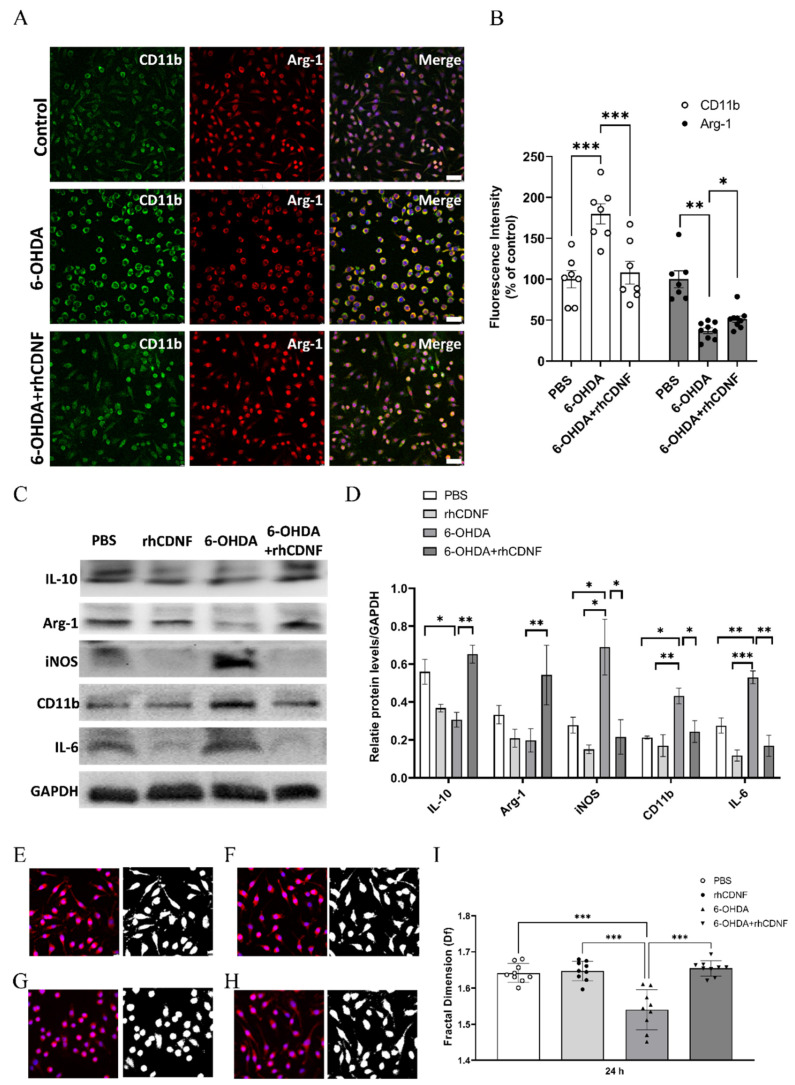
Figure 9.
Effects of CDNF on 6−OHDA−stimulated BV2 microglial cells. (A) Representative pictures of BV2 cells double-stained for CD11b (green) or Arginase−1 (Arg−1; red), and nuclei were counterstained with DAPI (blue). Photomicrographs were taken with an epifluorescence microscope; scale bar = 50 µm. (B) The fluorescent intensities divided by the untreated BV2 cells (control group). There was an increase in CD11b fluorescent intensity in BV2 cells after 6−OHDA treatment as compared with the untreated BV2 cells (control group), and rhCDNF given simultaneously with 6-OHDA decreased activated CD11b intensity in BV2 cells. In contrast, the fluorescent intensity of Arg-1 in 6-OHDA-stimulated BV2 cells was lower than the control group, which was upregulated by CDNF supplementation. (C) Lysates from BV2 cells after PBS, rhCDNF, 6-OHDA, or 6-OHDA + rhCDNF treatment were immunoblotted and IL10, Arg−1, iNOS, CD11b, IL−6, and GAPDH levels were analyzed. (D) Protein levels were quantified in relation to levels of GAPDH, a housekeeping protein (n = 5, mean ± S.E.M). (E–H) Morphological analysis of Iba1−stained BV2 cells. The process to prepare photomicrographs for morphological analysis: Original photomicrographs were subjected to a series of uniform ImageJ plugin protocols prior to conversion to binary images. Binary images were then analyzed by using FracLac for ImageJ, which quantifies single cell complexity (fractal dimension, fD). The calculated fD of the cell is shown below its binary image. Representative images of morphological changes in Iba1-staining cells within PBS-treated BV2 cells (E), rhCDNF−treated BV2 cells (F), 6−OHDA-treated BV2 cells (G), and rhCDNF supplementation in 6−OHDA−treated BV2 cells (H). (I) Summary data and statistical analysis of fractal dimension in 24 h cultured BV2 cells. Fractal dimension was decreased in the 6−OHDA compared with the PBS or rhCDNF alone treatment. However, rhCDNF given simultaneously with 6-OHDA treatment restored the fractal dimension of Iba1−positive cells (n = 18−22, one-way ANOVA p < 0.001, *** p < 0.001, ** p < 0.01, * p < 0.05 compared to 6-OHDA, Tukey’s post hoc test). The data represent mean ± SEM.

