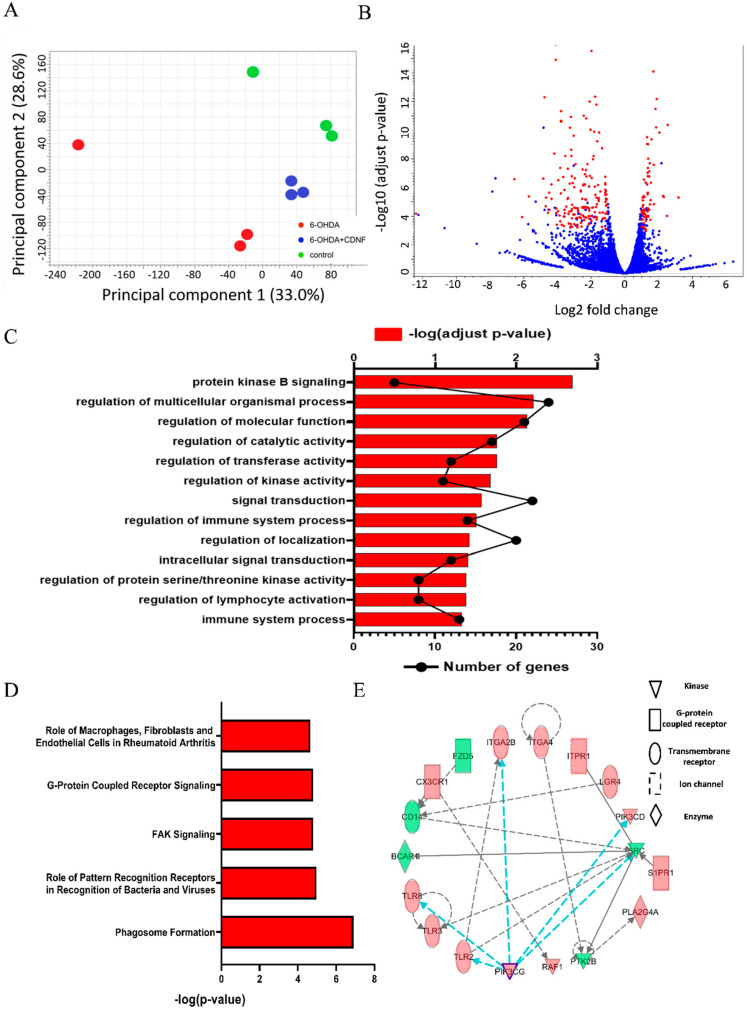
Figure 10.
CDNF treatment regulates gene expression in the 6−OHDA−stimulated BV2 microglial cells. (A) Principal component analysis (PCA) of the transcriptomes among control, 6−OHDA, and 6−OHDA + rhCDNF groups. (B) Volcano plot comparing the log2fold changes and adjusted p-values of 21,860 gene expressions. The red dots indicate genes significantly regulated (log2fold change >1 or <−1 adjusted p-value < 0.001), and the blue dots indicate genes with no significant change between 6−OHDA and 6−OHDA + rhCDNF. (C) GO biological processes overrepresentation analysis based on 253 DEGs. (D) Ingenuity® Bioinformatics pathway analysis revealed that highly canonical pathways were differentially expressed in PBS−treated and rhCDNF−treated BV2 cell lines in response to 6−OHDA stimulation. The canonical pathways included in this analysis are shown along the y-axis of the bar chart. The x−axis indicates the statistical significance. Calculated using the right-tailed Fisher exact test, the p−value indicates which biologic annotations are significantly associated with the input molecules relative to all functionally characterized mammalian molecules. (E) The activity of highly connected positive regulators of the inflammatory genes PI3KCG, PI3KCD, TLR2, and TLR8 led to the activation of this phagosome formation network, as assessed using the IPA molecule activity predictor in rhCDNF−treated BV2 cells after 24 h 6−OHDA stimulation.

