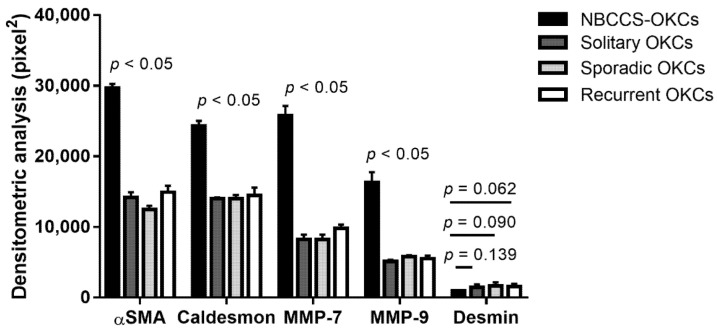
Figure 5.
Densitometric analysis. A bar chart represents the comparison of the densitometric count (pixel2) of αSMA, caldesmon, MMP-7, MMP-9, and desmin immunostaining in the evaluated fields for NBCCS-OKCs tissue compared to solitary, sporadic and recurrent OKCs tissue, expressed by positive percentage, dark brown pixels of the analyzed fields. Data are presented as mean ± standard deviation (SD).

