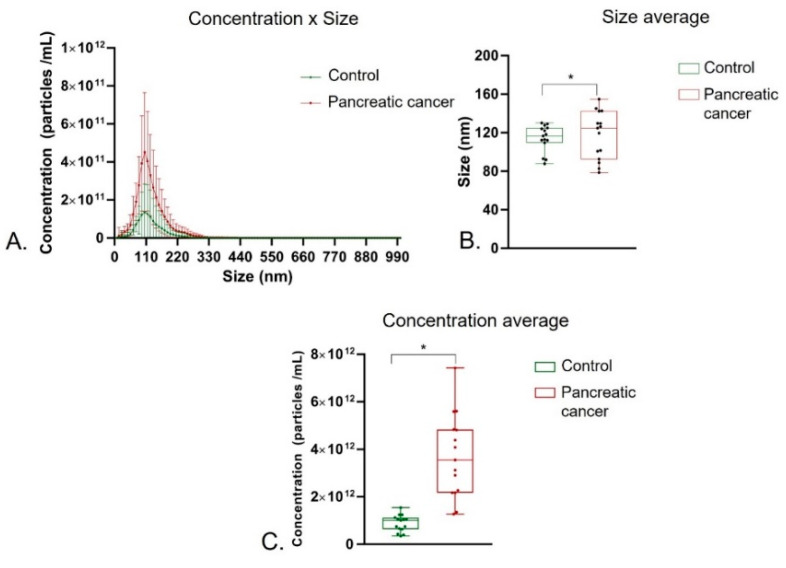
Figure 1.
Nano tracking analysis of plasma exosomes isolated from healthy individuals and pancreatic cancer patients. (A) Concentration average of exosome population observed between control group and pancreatic cancer patients. (B) Average size of exosome population observed between control group and pancreatic cancer patients. (C) Comparation of population concentration profile exosome plasma, from control group and pancreatic cancer patients (A,B). The results were analyzed by t-test, comparing the plasmas of patients with the control. (* p ≤ 0.05). EV: extracellular vesicle.

