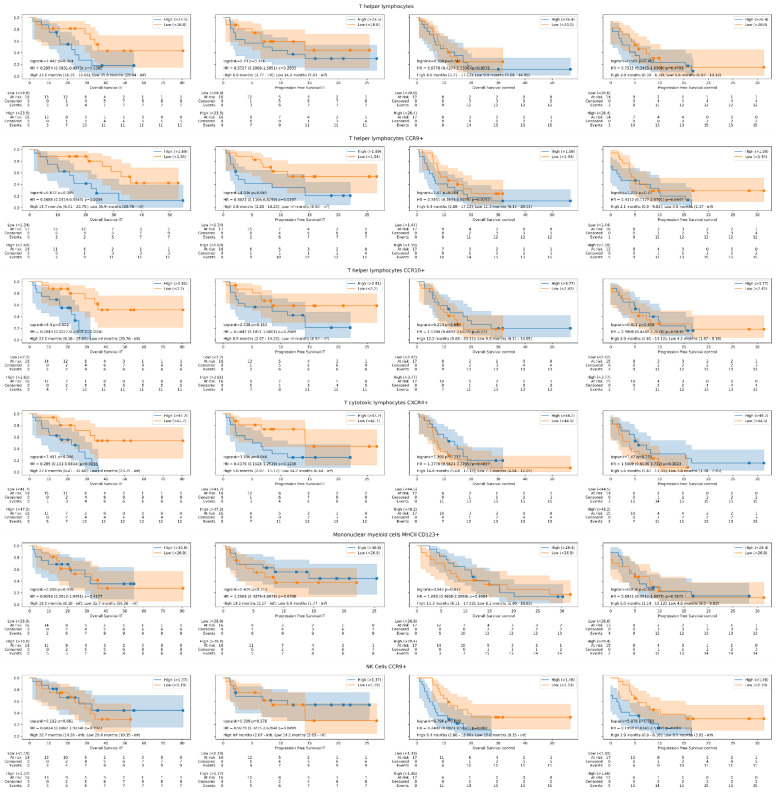
Figure 3.
Overall survival and progression-free survival Kaplan–Meier curves in study and control groups according to the best immune biomarkers detected. The Kaplan-Meier curves show the differences in survival according the high or low expression of each peripheral blood mononuclear cell subpopulation studied in immunotherapy treated (IT) group and in control group treated with non-immunotherapy drugs. In addition, the log-rank test, multivariate cox regression models, and the median progression-free and overall survival values with their range are reflected.

