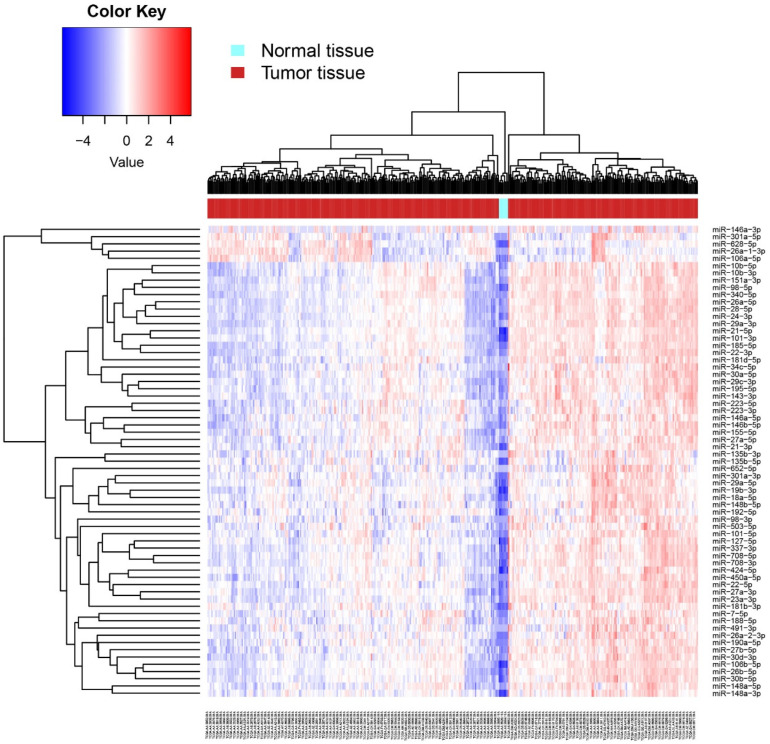
Figure 4.
Heat map of differential expression of hypoxaMIRs in human normal and tumor tissues. Differential expression of hypoxaMIRs was identified in normal tissue and tumor tissue by a miRNA body map along with the hierarchical cluster analysis. Expression of hypoxaMIRs is represented as blue (downregulated), red (upregulated), and white colors (no significant change or absence of data).

