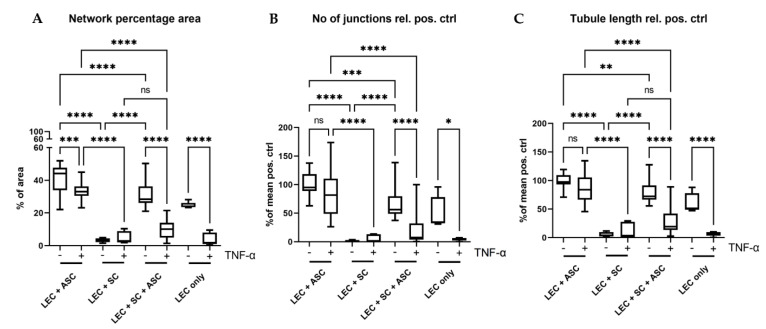
Figure 5.
Quantification of the formed lymphatic networks in 3D fibrin clots. (A) Evaluation of the average area covered by lymphatic networks in percentage of total area. (B) Evaluation of the average number of junctions relative to the mean of the positive control (LEC + ASC). (C) Quantification of the average lymphatic tubule length relative to the mean of the positive control (LEC + ASC). In all parameters, the triple culture of LECs, SCs, and ASCs showed significantly lower levels than the positive control (LEC + ASC) (A–C). Co-culture of LECs with SCs inhibited network formation, whereas addition of ASCs reversed this effect. Furthermore, the effect of pro-inflammatory TNF-α on the formation of lymphatic networks was also evaluated. Here, we observed a larger negative effect of TNF-α on the triple-culture, when compared to the positive control in all parameters. LEC + ASC, LEC + SC and LEC + ASC + SC: n = 8 each of 4 independent experiments, LEC only: n = 4 of 2 independent experiments. * p < 0.05, ** p < 0.01, *** p < 0.001, **** p < 0.0001, ns not significant.

