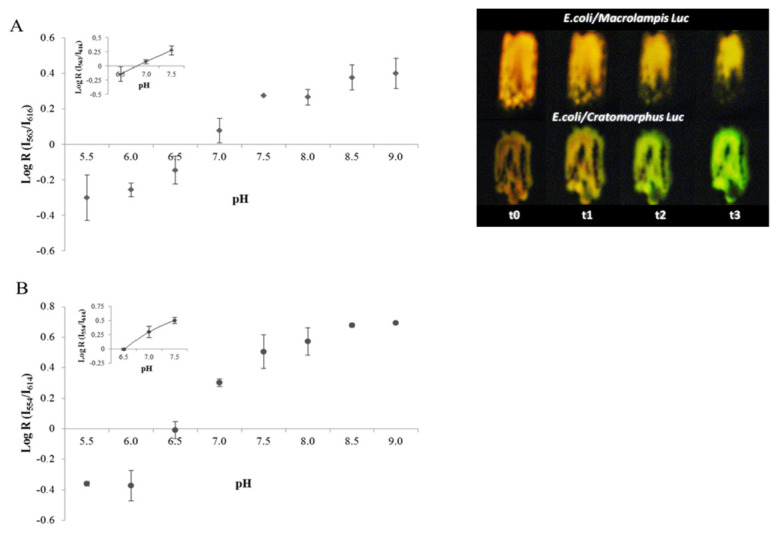
Figure 6.

(Left graph) ratiometric analysis of pH in bacteria using: (A) Macrolampis and (B) Cratomorphus firefly luciferases; (right image) effect of pH on in vivo bioluminescence of E. coli colonies expressing Macrolampis and Cratomorphus firefly luciferases; (t0–t3) represent the time (minutes) when the bioluminescence image was taken after addition of acidic D-luciferin. Reprinted with permission from ref. [32]. Copyright 2014 Royal Society of Chemistry.
