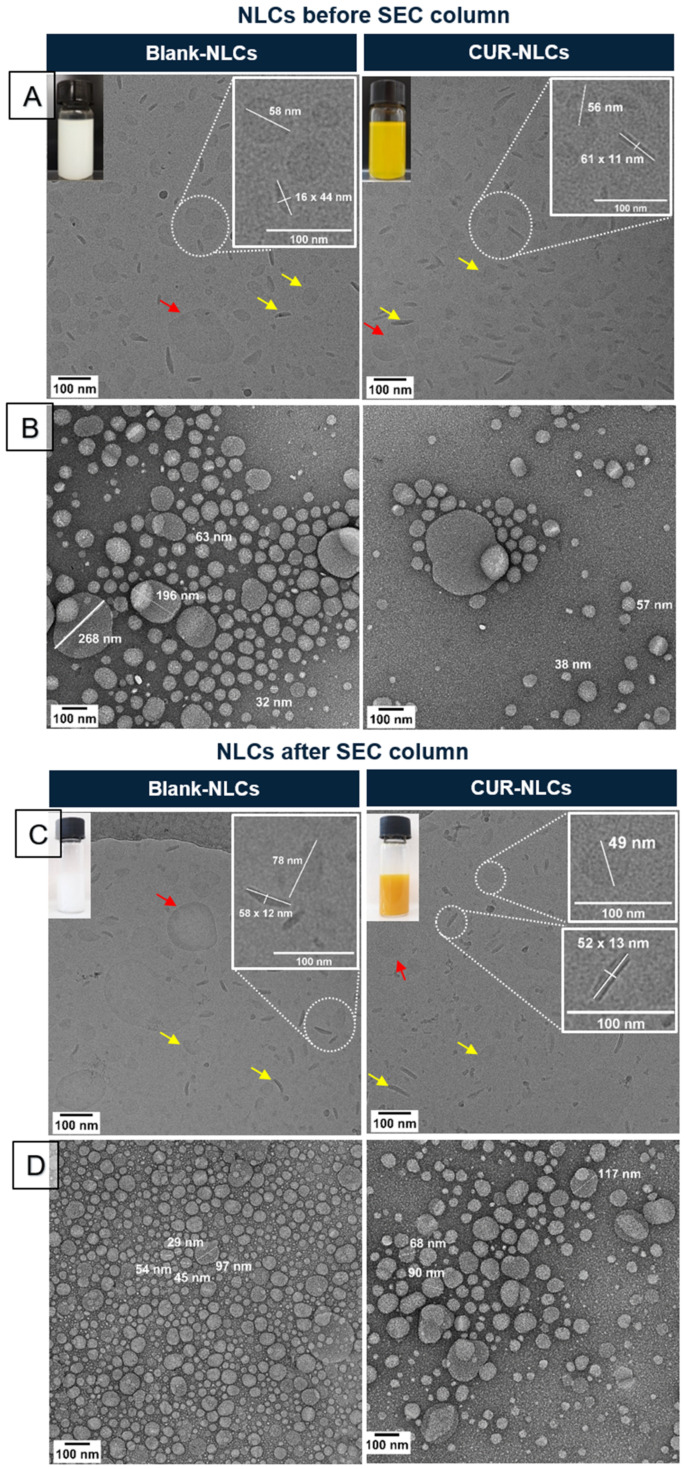
Figure 4.
Morphological characterization of Blank-NLC and CUR-NLC suspensions. (A) Visual aspect and cryo-TEM images of samples before passing through the SEC column. (B) TEM images of samples before passing through the SEC column and after negative staining with uranyl acetate 2% v/v in water. (C) Visual aspect and cryo-TEM images of samples after passing through the SEC column. (D) TEM images of samples after passing through the SEC column and after negative staining with uranyl acetate 2% v/v in water. Yellow arrows show the ovoid platelet (top view) or rod (side view) shapes of small-size-NLC population. Red arrow shows the top view of large-size-NLC population.

