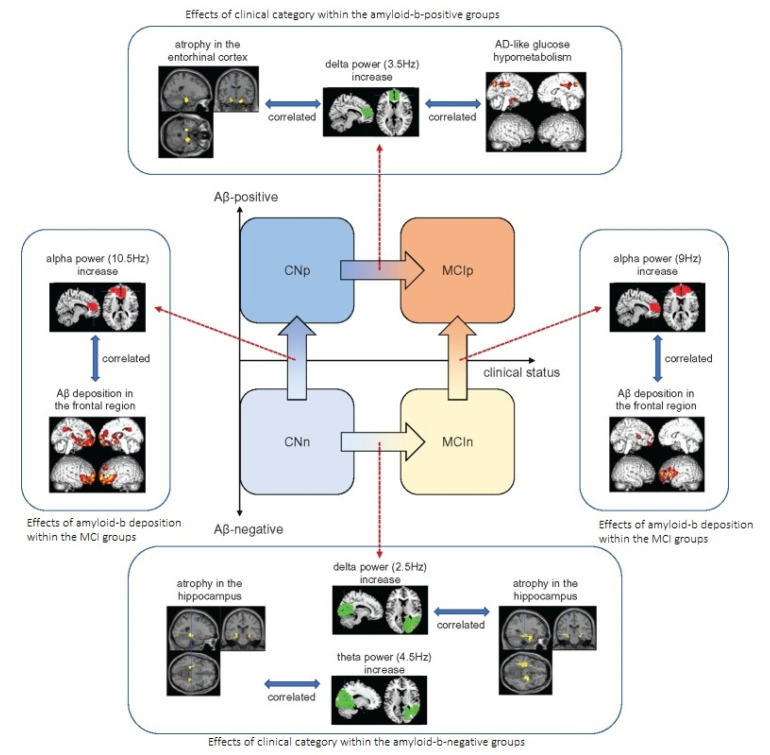
Figure 6.
The characteristics of the MEG power markers. The arrows with the gradation colors indicate the directions where the relative power increases (not indicating clinical transition). Reprinted from [76]. (Copyright 2018 Oxford University Press) Image reproduced as per terms of CC BY-NC 4.0 license.

