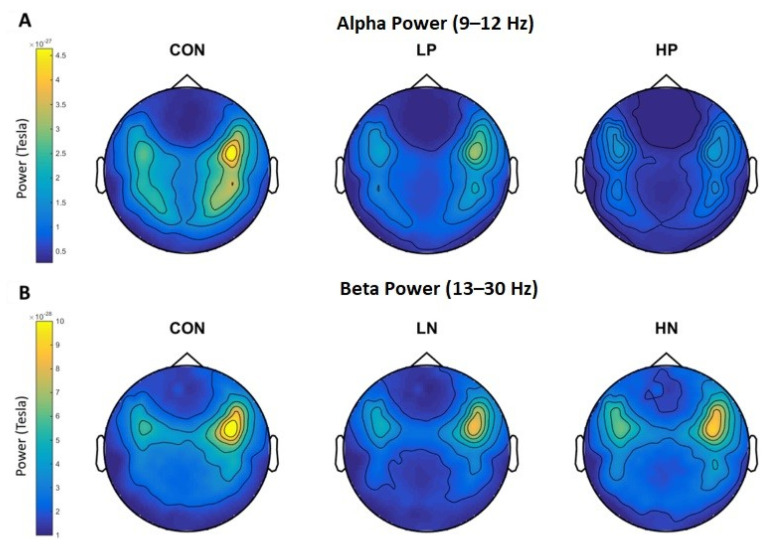
Figure 7.
Topoplots of alpha power (A) for Con, Low positive (LP), and High Positive (HP); and of beta power (B) for Con, Low Negative (LN), and High Negative (HN) Schizophrenia patients. Colors represent power levels. Reprinted from [91]. (Copyright 2018 Elsevier) Image reproduced with copyright permission.

