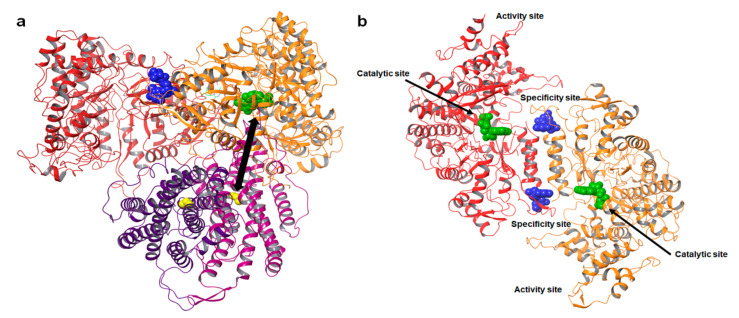
Figure 1.
Structure of ribonucleotide reductase. (a) Model of the E. coli α2β2 dimer complex (PDB ID: 6W4X) [32]. The α dimer is shown in red and orange. The nucleotide bound at the C—site is represented as green spheres. The nucleotide effect abound at the S—site is represented as blue spheres. The β subunit is shown in magenta and purple; the yellow spheres represent the radical generating di-iron cluster. The iron cluster and C-site are separated by a distance of over 35 Å, shown as a double arrow. (b) Structure of the hRRM1 dimer. The nucleotide bound at the catalytic site (C-site) is rendered as green spheres. The specificity site (S-site) controls substrate selection at the C-site and is represented as blue spheres. The activity site (A-site) controls the overall activity of the enzyme by binding the natural allosteric activator ATP or inhibitor dATP.

