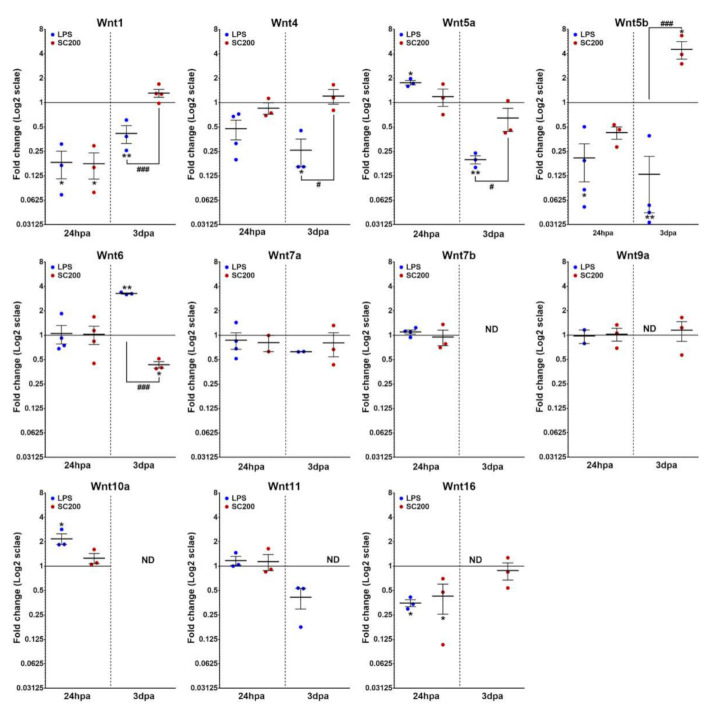
Figure 2.
mRNA expression analysis of Wnt ligands in LPS- or SCE-activated microglia and compared to non-activated basal conditions. The figure shows mRNA expression data corresponding to different detectable Wnt ligands in activated microglial cells either with 100 ng/mL of lipopolysaccharide (LPS) or with 200 µg/mL of lesioned spinal cord extract (SCE). Data represent 2ΔΔCt mean ± SEM. * indicate differences between treated cells vs. non-activated. # indicate differences between treatments (LPS vs. SCE). * p < 0.05; ** p < 0.01; *** p < 0.001; # p < 0.05; ## p < 0.01; ### p < 0.001. hpa: hours post-activation; dpa: days post-activation.

