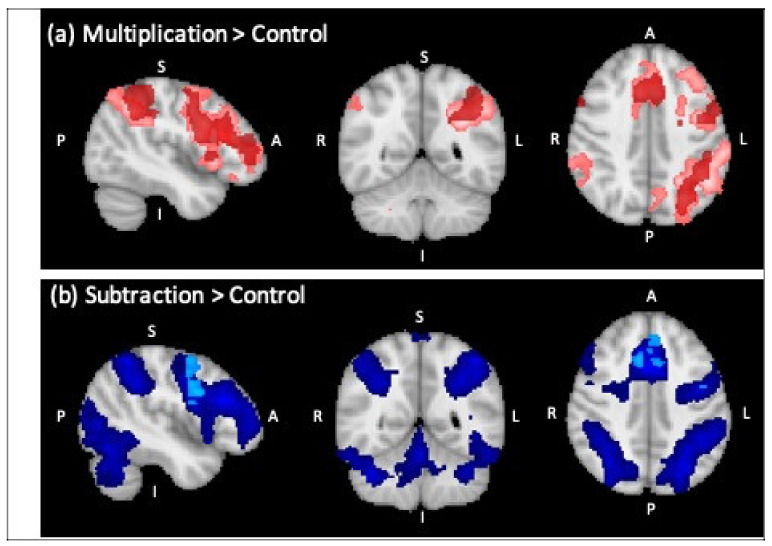
Figure 2.
Overlay of regions of significant BOLD signal change for the control group in dark color and for RM in light color (sagittal, coronal and axial view from left to right). (a) Multiplication versus control (cluster threshold Z = 2.3) (RM in light red, control group in dark red), (b) subtraction versus control (cluster threshold Z = 2.3) (RM in light blue, control group in dark blue).

