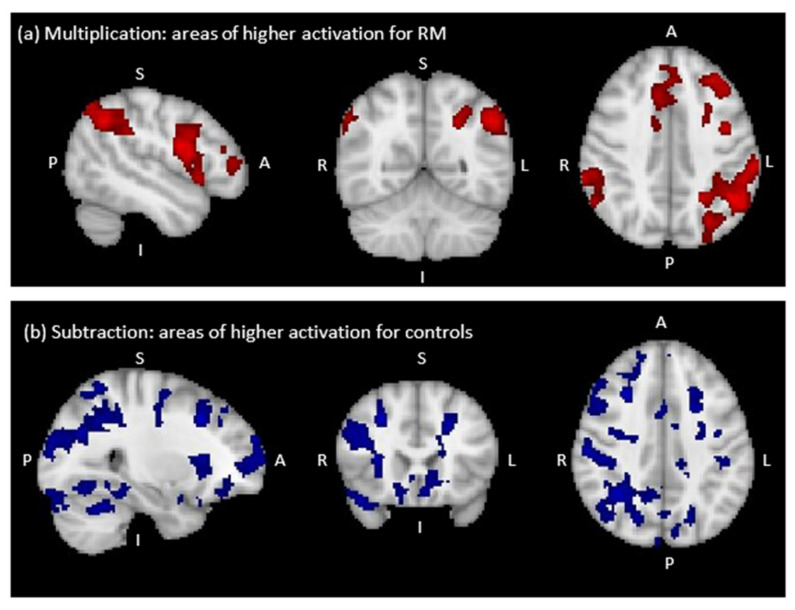
Figure 4.
Regions of significant differences in BOLD signal change between RM and the control group (sagittal, coronal and axial view from left to right). (a) Higher activation for RM than the control group in multiplication versus control (cluster threshold Z = 2.3), (b) Lower activation for RM than the control group in subtraction versus control (cluster threshold Z = 3.1).

