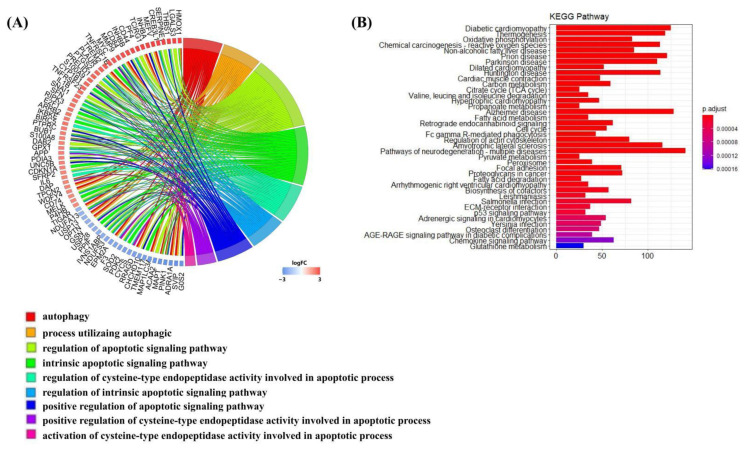
Figure 6.
Enrichment analysis of DEGs on day 3 post-MI in mRNA-seq data. (A) Circle diagram of the biological analysis of DEGs on day 3 post-MI. Different color blocks represent different biological processes. The circle diagram below shows the biological processes associated with autophagy and apoptosis. (B) Bar chart of the KEGG analysis of significant DEGs on day 3 post-MI. The first 40 pathways are shown in the figure, and the p cut-off value of all pathways is 0.05.

