Figure 4.
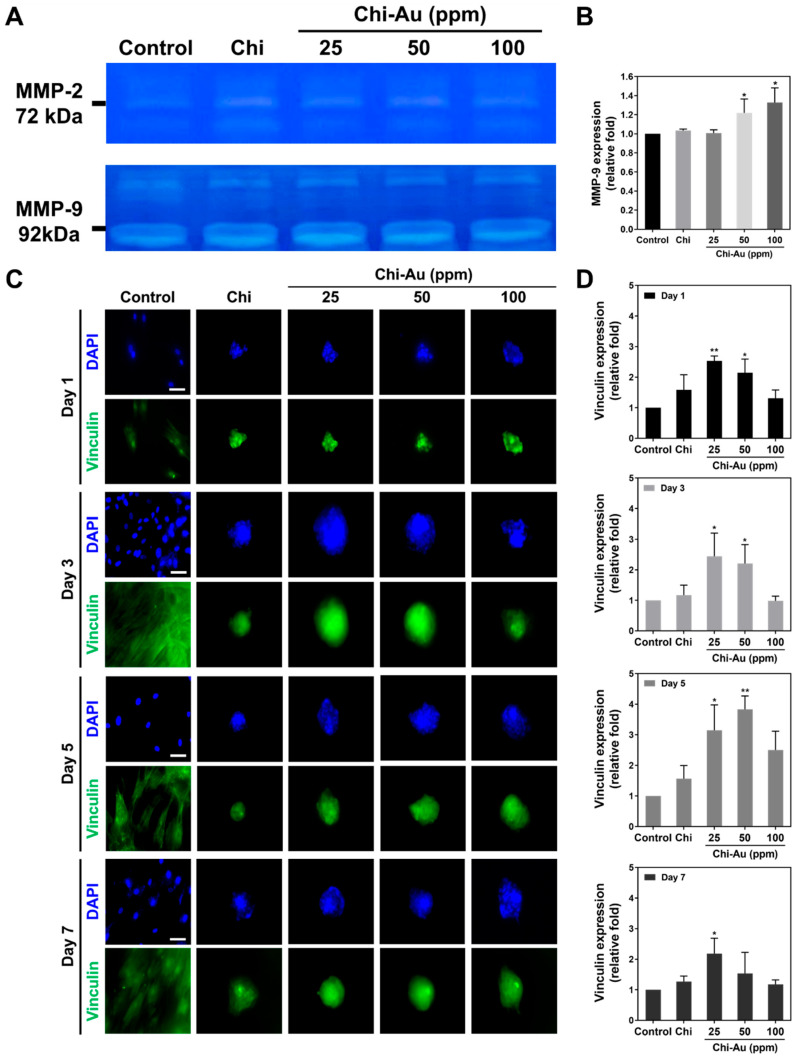
Expression of MMP-2/9 protein and vinculin in MSCs incubated with Chi–Au nanocomposites. (A) The MMP-2/9 protein expressions at 48 h are shown. (B) The MMP-9 protein expression was semi-quantified. The MMP-9 protein expression was significantly increased in the Chi–Au 50 and 100 ppm groups. (C) The images of vinculin expression in MSCs were demonstrated by immunofluorescence staining at 1, 3, 5, and 7 days. Scale bars measure 20 μm. (D) The expression of vinculin in MSCs at various time points was semi-quantified according to expression intensity. The vinculin expression was significantly higher when treated with Chi–Au 50 ppm at 5 days. Data are displayed as mean ± SD (n = 3). * p < 0.05, ** p < 0.01: compared with the control (TCPS).

