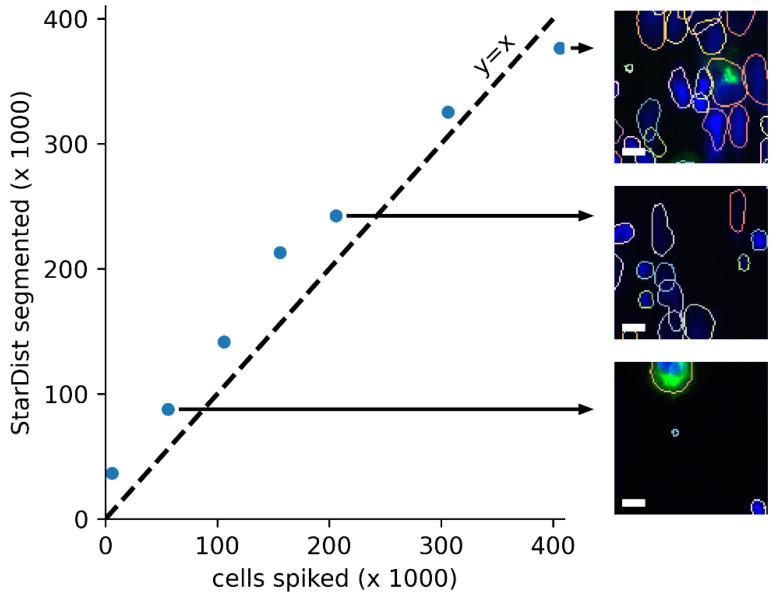
Figure 3.
Performance of StarDist segmentation on increasing numbers of spiked cells. Comparison of number of spiked cells in the cartridge versus the number of events detected by Stardist showing a good correlation up to the maximal density that can be imaged using the CellTracks Analyzer II (scale bar is 10 µm).

