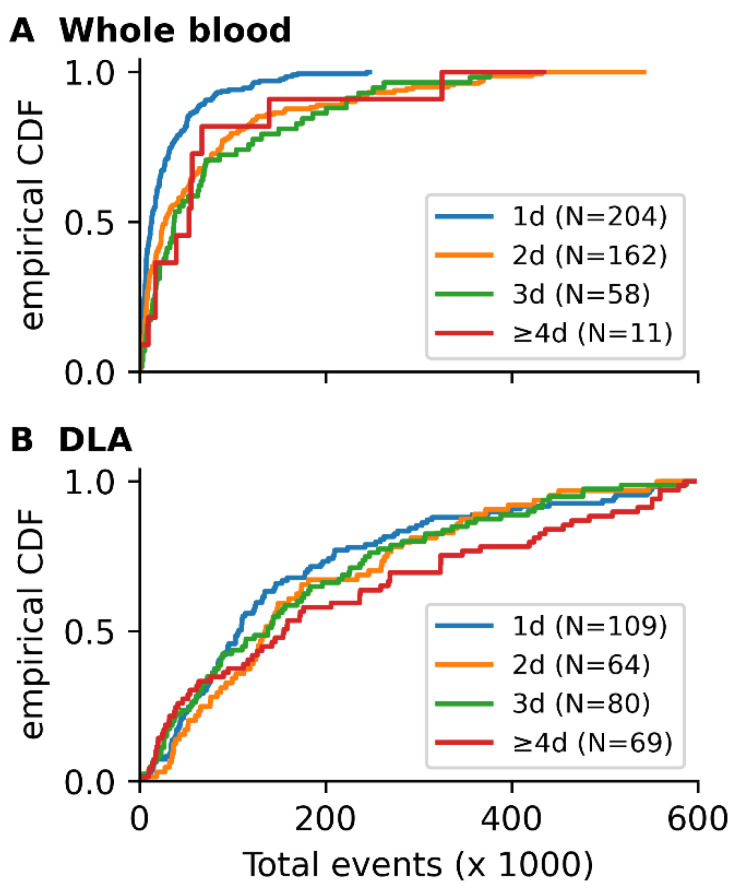
Figure 4.
Cumulative distribution functions (CDF) of (A) blood and (B) DLA samples with different collection to prep intervals. (A) The cumulative distribution functions of samples with one, two, three, and four+ days (d) between blood draw and sample preparation show a clear increase in cell density for time intervals of more than one day in (A) whole blood and (B) DLA samples. While a dependence of the number of events on the time from sample collection to sample preparation may also be observed in DLA samples, the difference is less pronounced than in blood.

