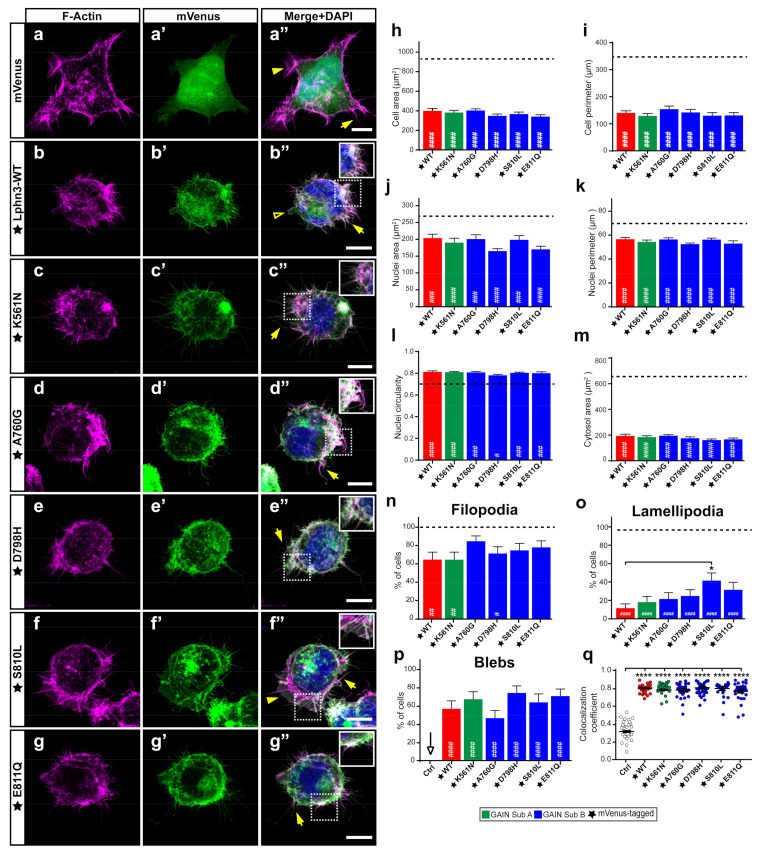
Figure 5.
Lphn3-mediated actin remodeling is altered by the presence of S810L mutation. Representative confocal fluorescence microscopy images of HEK293 cells expressing (a’–g’) mVenus (Ctrl) or the indicated mVenus-tagged Lphn3 variants (green), for which (a–g) F-actin was stained with phalloidin rhodamine (magenta) and (a’’–g’’) DAPI for nuclei (blue) in corresponding merged images. Inset images show colocalization of F-actin with the receptor represented as white pixels. Actin-dependent extensions are indicated as follows: filopodia (arrow), lamellipodia (arrowhead) and blebs (empty arrowhead). Scale bar: 10 µm. (h–m) Quantification of the different cellular and nuclear dimensions. (n–p) Quantitation of actin-dependent extensions present in transfected cells. Dotted line represents values obtained for mVenus-expressing cells used as control. (q) Pearson’s coefficient scatter plot representing coincident pixels between F-actin rhodamine signal and fluorescence emitted by mVenus-tagged Lphn3 variants. Subdomain A (GAIN Sub A) and B (GAIN Sub B) of GAIN domain. mVenus-tagged receptor constructs are indicated by a star (★). Data are represented as the mean values of at least three independent experiments (n = 3). At least 30 cells were analyzed for each condition. Statistical analysis was performed using one-way ANOVA. Error bars indicate S.E.M., p values between mVenus-tagged Lphn3-variants and control data are indicated by # inside histograms, while p values between mVenus-tagged Lphn3-variants and Lphn3-WT are indicated by *: #### or **** p ≤ 0.0001, ### p ≤ 0.001, ## p ≤ 0.01, # or * p ≤ 0.05.

