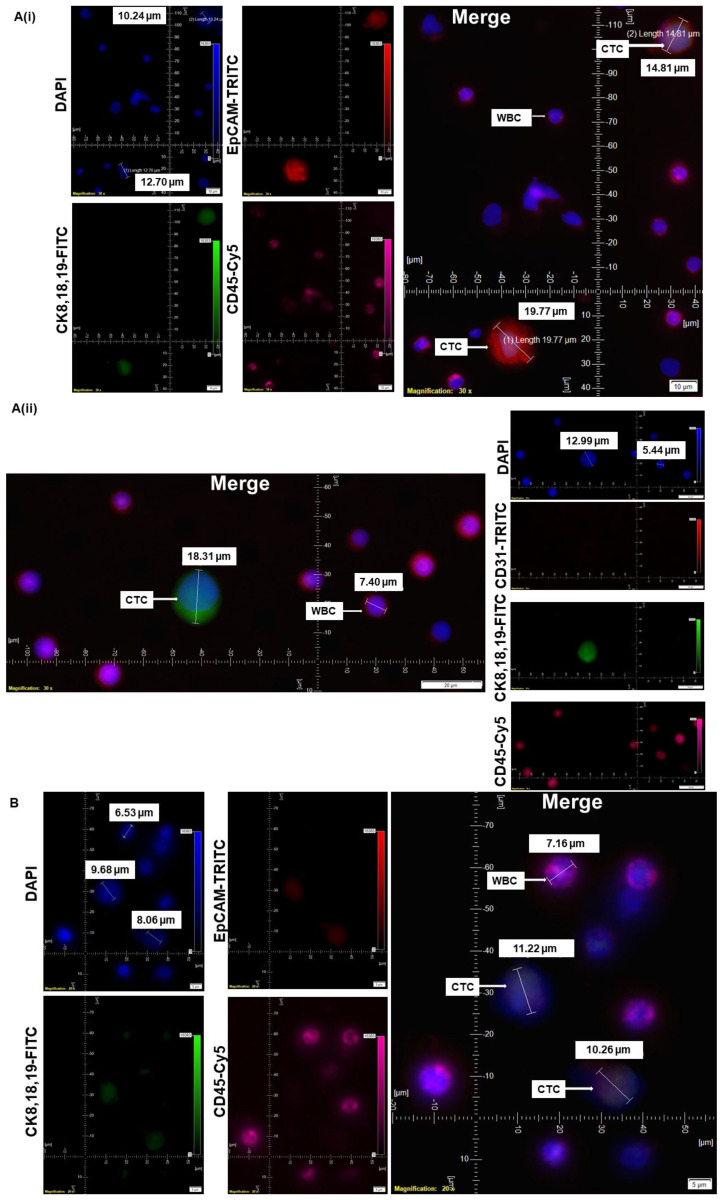
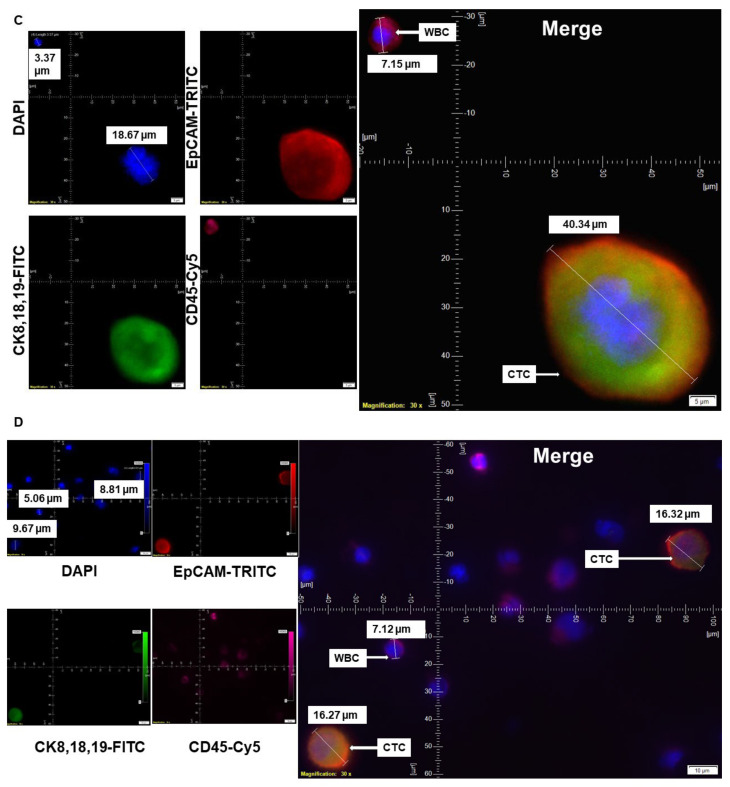
Figure 1.
Standardization and validation of CTC by IF×3 using breast, ovarian, and lung cancer cell lines: Patients’ blood samples spiked with titrating number (1000 cells, 750 cells, 375 cells, 250 cells/100 cells) of cell lines of different solid tumors using. Pictures were taken at 60× oil objective of an Olympus IX71 Microscope with DAPI/FITC/TRITC/CY5 filter sets. (A): MCF7 cells (750 cells/375 cells per 7.5 mL of patient’s blood) were used for spiking blood samples, and cells were captured on a microfilter and stained with a CellSieve enumeration kit (Creatv Microtech) with either DAPI/CK-FITC/EpCAM-PE/CD45-Cy5 (Ai) or DAPI/CK-FITC/CD31 PE/CD45-Cy5 (Aii). (B): OVCAR3 cells (100 cells per 7.5 mL of patient’s blood) were used for spiking blood samples, and cells were captured on a microfilter and stained with cell sieve enumeration kit (Creatv MicroTech) with DAPI/CK-FITC/EpCAM-PE/CD45-Cy5. (C): HCC1975 cells (1000 cells per 7.5 mL of patient’s blood) were used for spiking blood samples, and cells were captured on a microfilter and stained with cell sieve enumeration kit (Creatv Microtech) with DAPI/CK-FITC/EpCAM-PE/CD45-Cy5. (D): NCI-H441 cells (250 cells per 7.5 mL of patient’s blood) were used for spiking blood samples, and cells were captured on a microfilter and stained with cell sieve enumeration kit (Creatv Microtech) with DAPI/CK-FITC/EpCAM-PE/CD45-Cy5. The magnification, scale bar, and digital reticle are represented for each photomicrograph. Fluorescence images from DAPI, FITC, TRITC, and Cy5 channels were separated as pictures with a color bar. The fluorescence-photomicrographs presented the diameters (μm) of CTC and a representative WBC and their respective DAPI stained nucleus.


