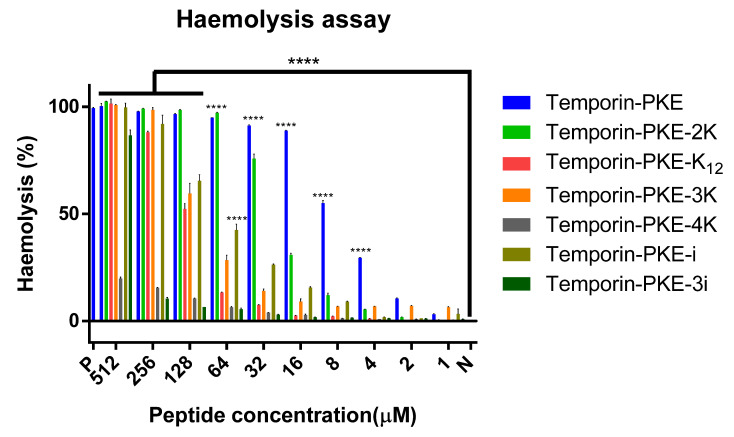
Figure 6.
The haemolytic activities of temporin-PKE and its analogues. N represents the negative control and P represents the positive control, PBS and 0.1% Triton X-100 in this experiment, respectively. The results were analysed by two-way ANOVA and Dunnett’s multiple comparisons test that compared haemolysis of various concentrations of peptides with the negative control group. The significance is indicated by ****, which represents p < 0.0001. The error bar represents the SEM of the nine replicates from three independent tests.

