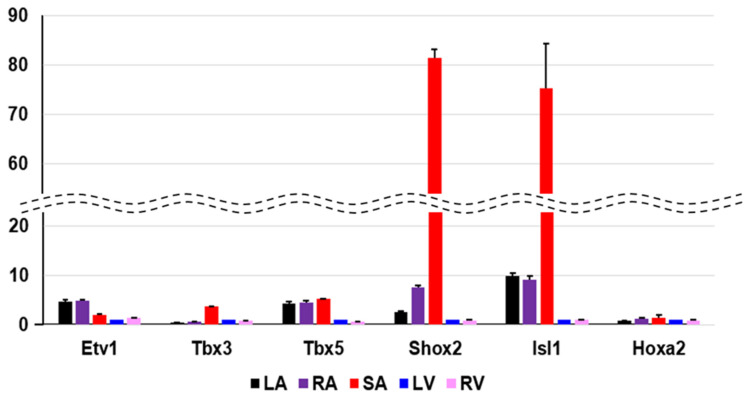
Figure 5.
Quantitative PCR validation of selected transcripts. The PCR result measures the expression of the ventricle with arbitrary unit 1, and shows how many times more than the expression of the ventricle. In our transcriptome analysis, Etv1 is atrium-specific, Tbx3, Shox2 and Isl1 are SA-specific genes in mice. With respect to Hoxa2, our specificity measure (SPM) criteria could not be confirmed. Each heart region is color-coded at the bottom. LA; left atrium, RA; right atrium, SA; sinoatrial node, LV; left ventricle, RV; right ventricle.

