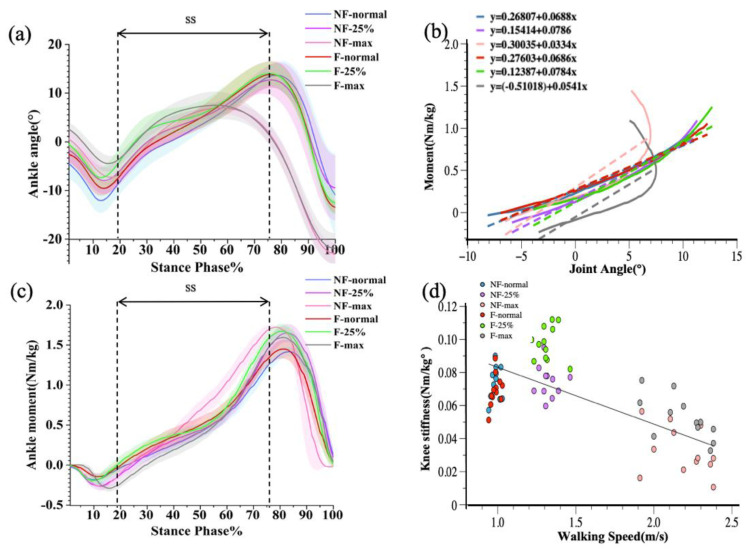
Figure 4.
Graphical representations of the ensemble mean and standard deviation for ankle angle (a) and ankle moment (b). Joint-moment plots representing the three walking conditions before and after walking training (c), with joint stiffness calculated for the single-leg support phase (SS). Correlation plots of ankle joint stiffness with walking speed before and after walking training (d).

