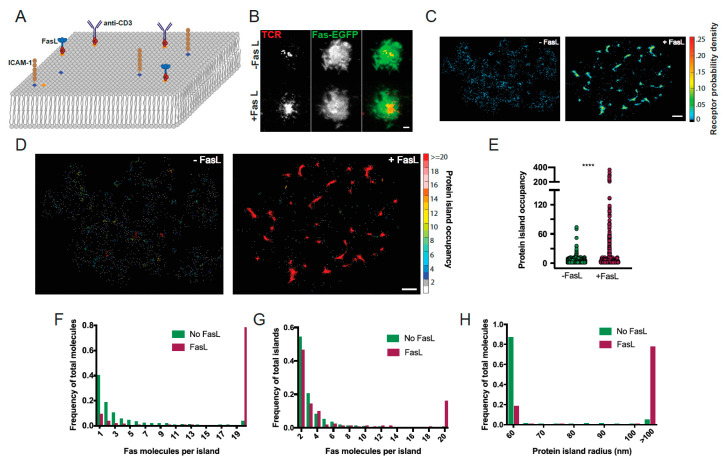
Figure 1.
SIM and PALM imaging of Fas receptor clustering after interaction with SLB-anchored FasL. (A) Schematics of the experimental setup used to image the spatial distribution of Fas receptors following stimulation with Fas ligand (FasL). Jurkat cells expressing Fas-EGFP were adhered to supported lipid bilayers (SLBs) containing FasL, ICAM-1, and anti-TCR (anti-CD3) antibodies. (B–D) Spatial distribution of Fas receptors on plasma membrane of Jurkat cells placed on SLBs. (B) Diffraction-limited TIRF images showing the distribution of Fas-EGFP (green) T cell receptors (labeled with anti-CD3 antibodies, red), with (bottom panel) or without (top panel) FasL added to the SLB. Scale bar = 2 microns. (C) PALM images of nanoscale spatial distribution of Fas-PAGFP receptor fusion proteins before (right panel) or after (left panel) engagement with FasL. The relative probability density of Fas receptors is mapped on to each pixel using the density color map on the right. Scale bar = 1 micron. (D) Spatial distribution of protein islands identified by cluster analysis of Fas PALM images acquired before (left) or after (right) stimulation with FasL. Individual receptors within a protein island are color-coded according to the number of Fas receptors (protein island occupancy, ϕisland) present in the protein island. Scale bar = 1 micron. (E–G) Plot of physical parameters of the protein islands obtained from spatial cluster analysis of the distribution of Fas receptors in PALM images. (E) Plot of distribution of number of Fas receptors per protein island (ϕisland) with or without stimulation with Fas ligand. Each circle represents a single protein island. Data are from four cells for each condition and are compared by two-tailed Mann–Whitney U test (p < 0.0001). (F) Plot of distribution of total Fas receptors that reside in protein islands containing indicated number of receptors. Data are shown for both with (magenta) or without (green) stimulation with Fas ligand. (G) Plot showing the frequency of occurrence of protein islands containing indicated number of Fas receptors (ϕisland). (H) Plot of percentage of total Fas receptors residing in protein islands of indicated size (radius in nm).

