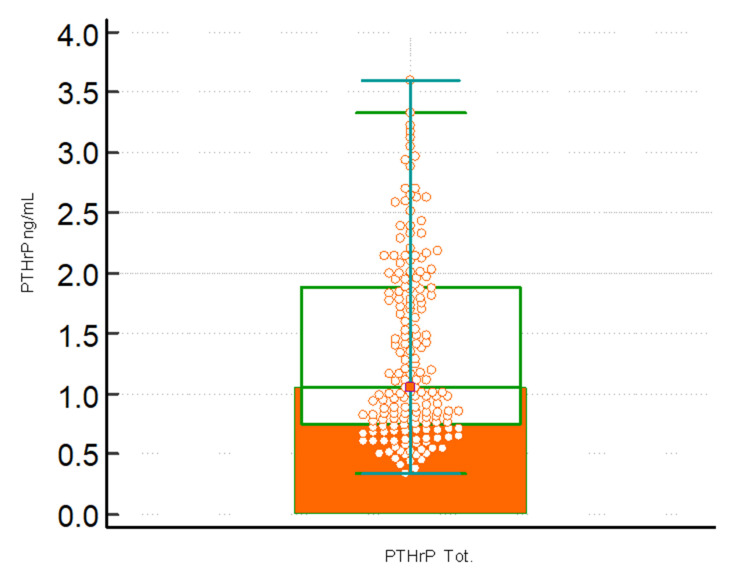
Figure 2.
Boxplot with the statistical summary of the concentration of PTHrP (ng/mL) obtained on the total of the subjects evaluated (PTHrP Tot.). The central box shows the values from the 25th to the 75th quartile, the central line the median, the horizontal lines the extension from the minimum to the maximum value (range). A possible outside is highlighted.

