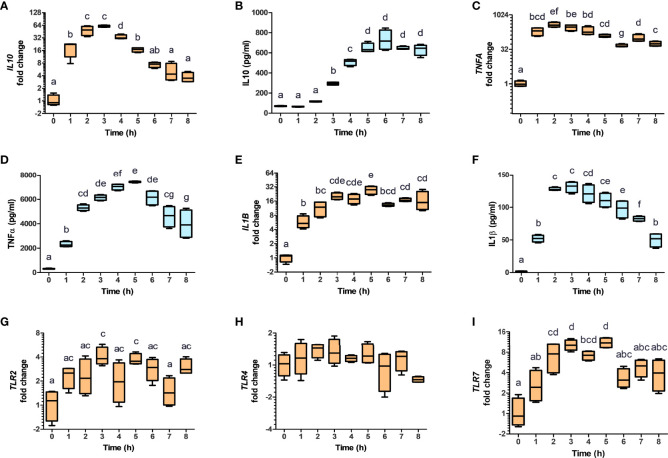
Figure 4.
Nanovesicles from Lactobacillus johnsonii shift macrophages towards a M2b profile. PMA stimulated THP-1 macrophages were incubated with NVs, cytokines and mRNA (A, C, E, G, H, I, orange box plots) and protein levels (B, D, F, blue box plots) were evaluated for 8 h. Cytokine concentrations were determined in the supernatants via ELISA, while mRNA levels were determined via qRT-PCR. The mRNA levels of IL10 (A), TNFA (C), IL1B (E), TLR2 (G), TLR4 (H) and TLR7 (I), were normalized to GAPDH, whereas the protein levels of IL-10 (B), TNFa (D) and IL-1b (F) were normalized to the total protein concentration. Data is shown as fold change ± SD with respect to Time 0. Data shown represents at least three biological triplicates and technical duplicates. Letters on top of each group represents statistical significance (p < 0.05), where bars sharing at least one letter are not significantly different.

