Figure 2.
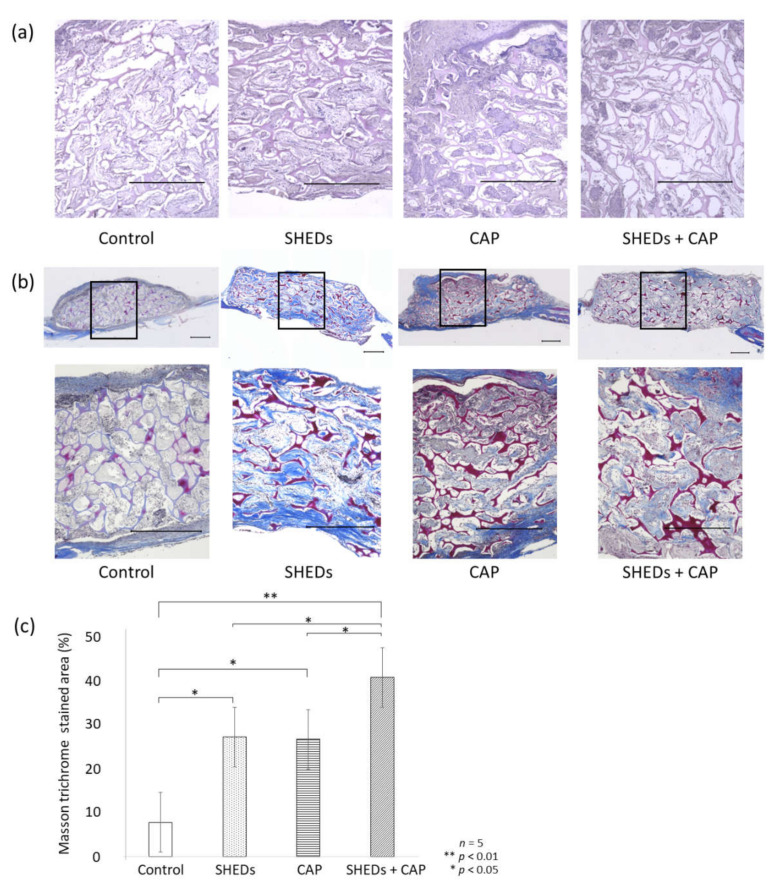
Histological evaluation of regenerated bone area. (a) Post H&E staining, the control group showed only a few calcified-like tissues, whereas the SHEDs + CAP group exhibited many such tissues. (b) MT staining showed a clear staining site for mature bone in the SHEDs, CAP, and SHEDs + CAP groups but not in the control group. (c) Percentage of stained area was significantly higher in the SHEDs + CAP group than in the other groups. n = 5 for each group, ** p < 0.01, * p < 0.05. Scale bars = 500 μm.

