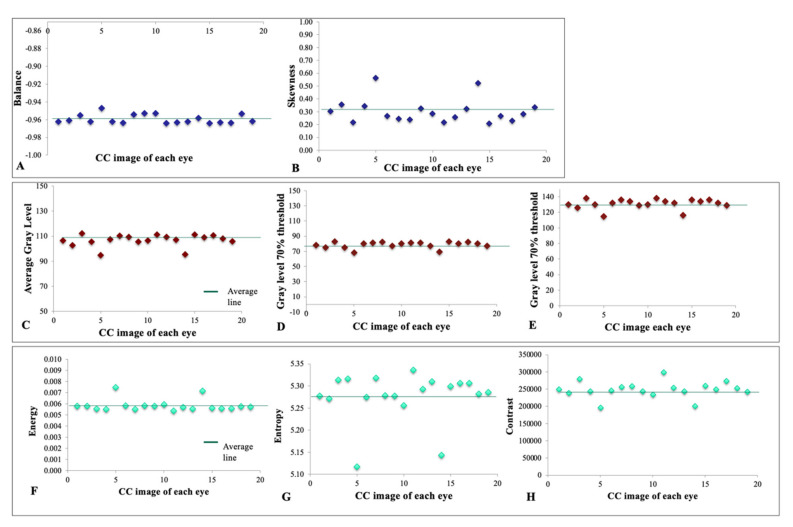
Figure 3.
Gray level histogram analysis consisting of measures of Balance (A) and Skewness (B). Absolute value of gray levels in OCTA images of choriocapillaris in each eye. These set of measures included average gray level (C), gray level with 30% (D) or 70% threshold (E). Spatial relationship among gray levels in OCTA images of choriocapillaris in each eye. Energy (F), entropy (G), and contrast (H) were measured in this category of measures.

