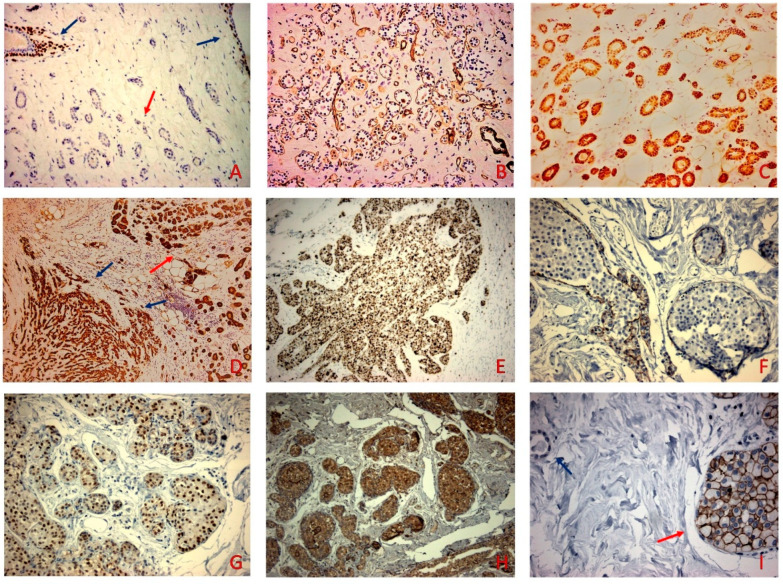
Figure 2.
(A) P63 was negative in the MGA (red arrow) while retaining positive nuclear staining in the neighboring normal ducts and acini (blue arrows) (p63 × 100). (B) MGA was surrounded by Laminin (Laminin × 100). (C) S-100 was positive in the MGA (S-100 × 200). (D) S-100 positive staining in the MMPC (blue arrows) and the adjacent MGA (red arrow) (S-100 × 100). (E) Proliferation index Ki67 stained 70% of tumor cells (F) E-cadherin did not stain the cells of the intraductal proliferation (E-cadherin × 200) (G) AR stained the PLCIS (red arrow) and was negative in the MMPC (AR × 200). (H) PLCIS stained for P504S (P504S × 100). (I) PLCIS (blue arrow) showed 3+ staining and was negative in the MGA component (red arrow) (HER-2 × 400).

