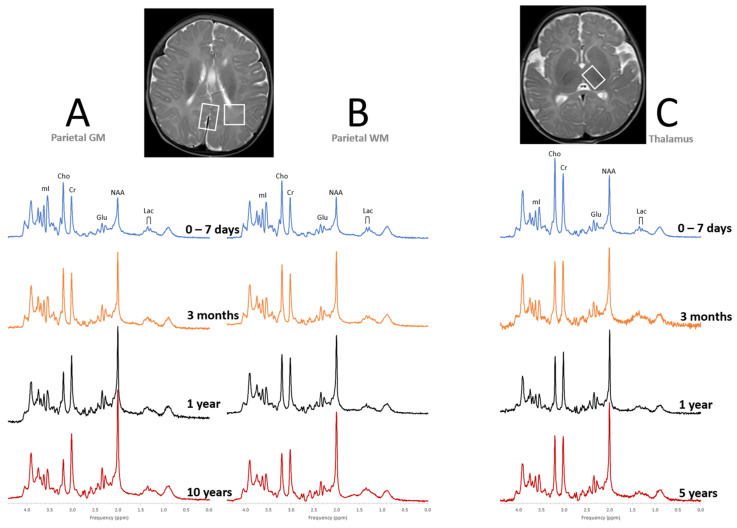
Figure 2.
Metabolic maturation of the human brain. Shown are representative “closest-to-normal” spectra for parietal gray matter (GM, A), parietal white matter (WM, B), and thalamus (C) acquired from pediatric term-born patients at different points of brain development. MR images as well as clinical follow up were unremarkable for all subjects. Note, that metabolic profiles vary both with age and tissue type. All spectra were acquired on 3T scanners with SV-PRESS, echo time (TE) = 35 ms, and repetition time (TR) = 2000 ms.

