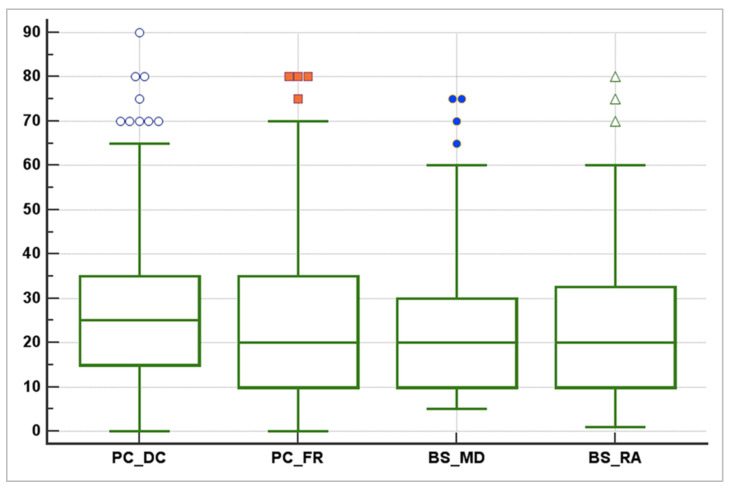
Figure 9.
The descriptive statistics from the radiologists’ measurements. The agreement between radiologists for visual estimation of pneumonia from CT was good, as shown in this box, plot scheme (ICC 0.79, 95% CI 0.73–0.84). Only one radiologist esteemed a higher visual score (considered as the median). ICC = Intraclass Correlation Coefficient, CI = Confidence Interval.

