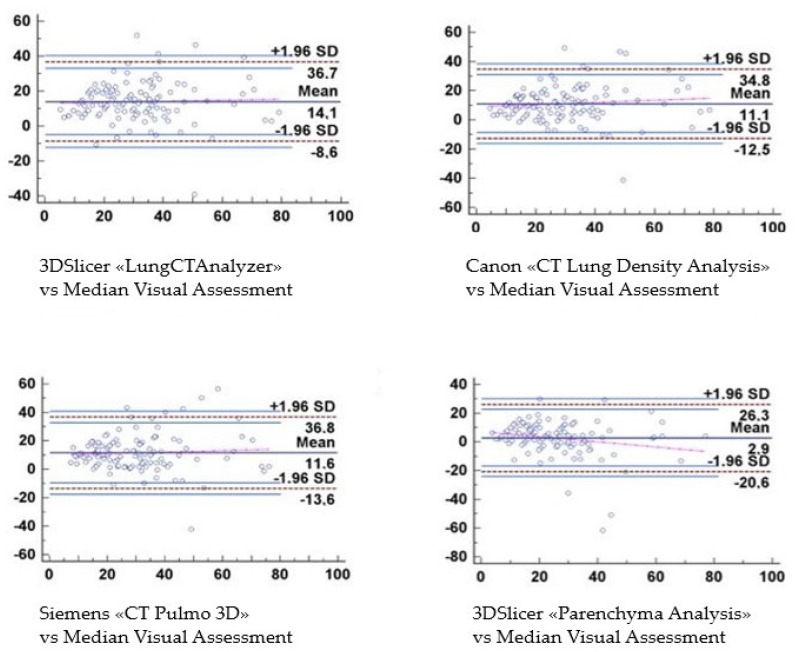
Figure 11.
Bland–Altman graphics demonstrate the trend of the values assessed. For the software “LungCTAnalyzer”, the results lie in a range between 36.7 and −8.6 with an SD of ±1.96. For the Canon software, the results filled the space between 34.8 and −12.5 with an SD of ±1.96; for the Siemens software, instead, the values were positioned between 36.8 and −13.6 with the same SD of ±1.96. Finally, the “Parenchyma Analysis” outcomes were placed between 26.3 and −20.6 with an SD of ±1.96. SD = Standard Deviation.

