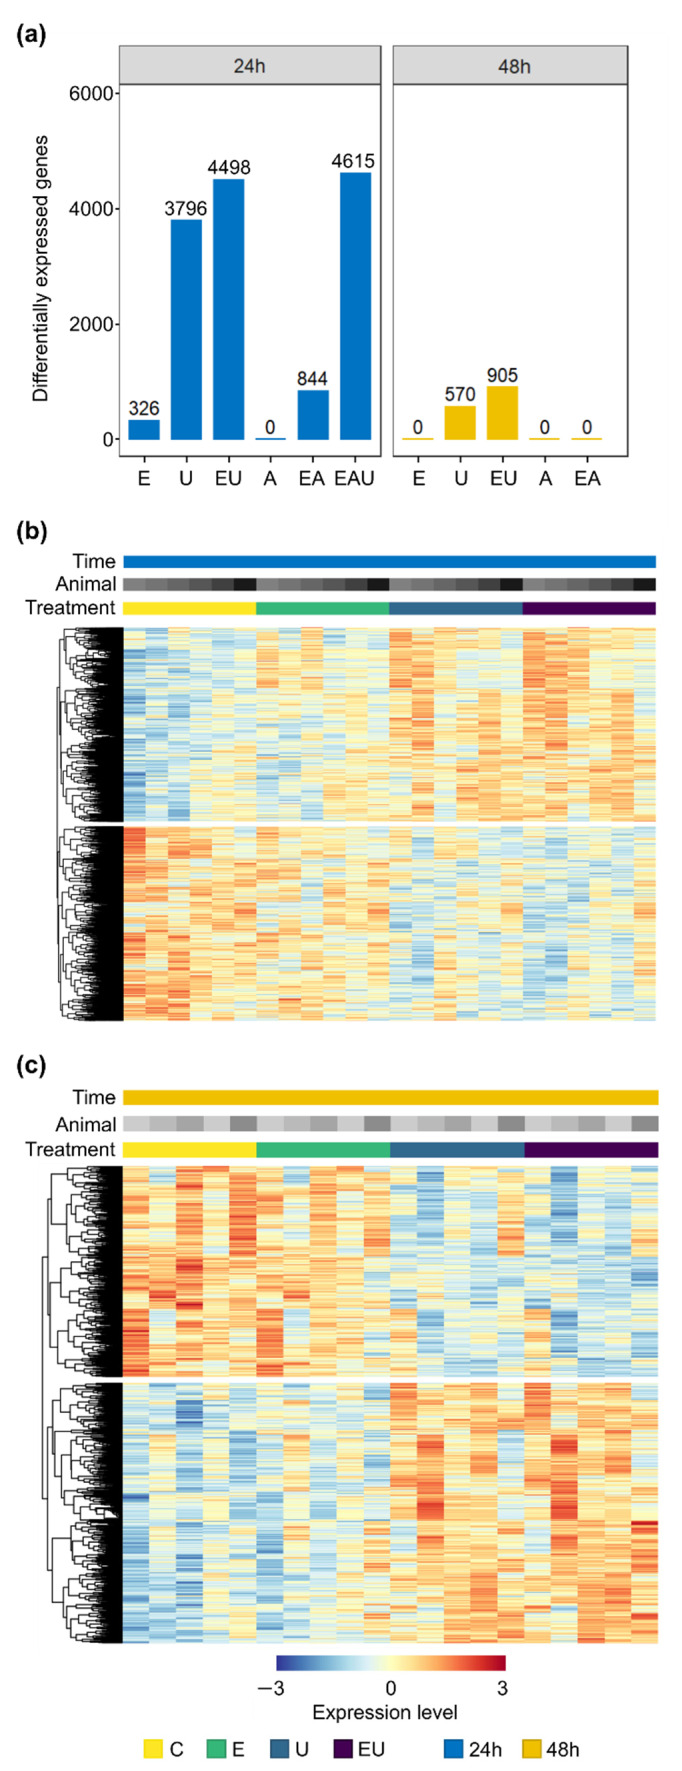
Figure 1.
EGF and U46619 lead to gene expression regulation in aVSMC but not AngII. E: EGF, U: U46619, EU: EGF and U46619, A: AngII, EA: EGF and AngII, EAU: EGF and AngII and U46619. (a) Number of differentially expressed genes (DEG) after 24 and 48 h incubation (compared to the respective control groups). (b,c) Heatmaps showing the normalized expression (log scale) of genes identified as significantly regulated for at least one comparison (EGF or U46619 or EGF and U46619-treated vs. control group) in the analyses for 24 h (b) or 48 h (c) incubation. A total of 4921 and 984 genes were thus included for each time point. Each row represents a gene, and each column a sample. Expression levels were additionally row-wise centered (subtraction of the mean from each value) and scaled (division by the standard deviation). Rows were clustered based on Euclidean distance (complete method, calculated by pheatmap, version 1.0.12—https://cran.r-project.org/package=pheatmap (accessed on 19 May 2022)). Heatmaps comprising all conditions are available in Supplementary Figure S3.

