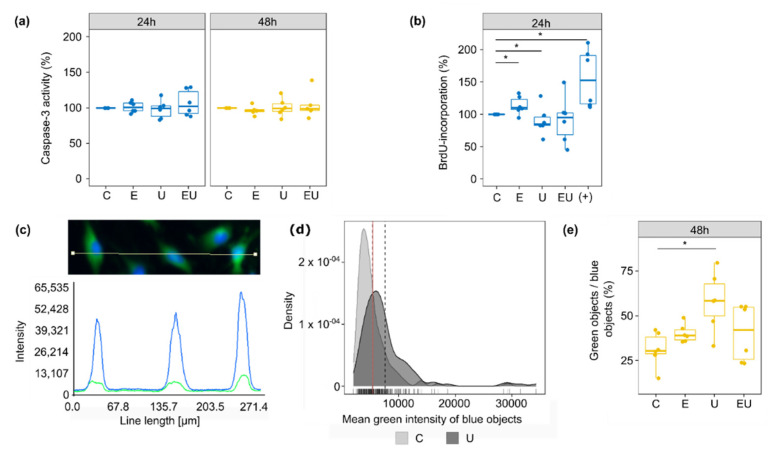
Figure 5.
Effect of EGFR and TP receptor activation on apoptosis, cell cycle and senescence. (a) Caspase-3 activity was measured after 24 and 48 h incubation with EGF and/or U46619. The control condition (media without stimuli) was used as a reference for each independent replicate (n = 5–6). (b) DNA synthesis rate was measured with BrdU incorporation after 24 h incubation with EGF and/or U46619. The supplemented media used for the usual cultivation of aVSMC (+) served as a positive control. The control condition (media without stimuli) was used as a reference for each independent replicate (n = 6). (c–e) β-gal activity was measured in the green channel (after staining with C12FDG) of a fluorescence microscope, while Hoechst staining (blue channel) permitted the identification of cell nuclei (blue object) (n = 6). (c) Because the green signal mostly co-localized with the blue one, the β-gal activity of a single cell was defined as the mean green intensity of the corresponding blue object. (d) In order to determine which objects showed an enhanced β-gal activity (senescent cells), the mean green intensity of blue objects was plotted for the control (lower signal) and U46619-treated (brighter signal) groups (density plots). The grey dashed lines and red solid one depict the mean for each distribution and the intersection of the two distributions, respectively. The value at the crossing of the red line on the x-axis was used as the cut-off to determine if an object was greener than randomly expected (green objects). This threshold was determined for each independent experiment. Each time, the Kolmogorov–Smirnov test was used to ensure that the shifts in distribution were significant (p < 0.05). (e) The fraction of senescent cells was defined as the percentage of blue objects that were also green. * Wilcoxon test p < 0.05.

