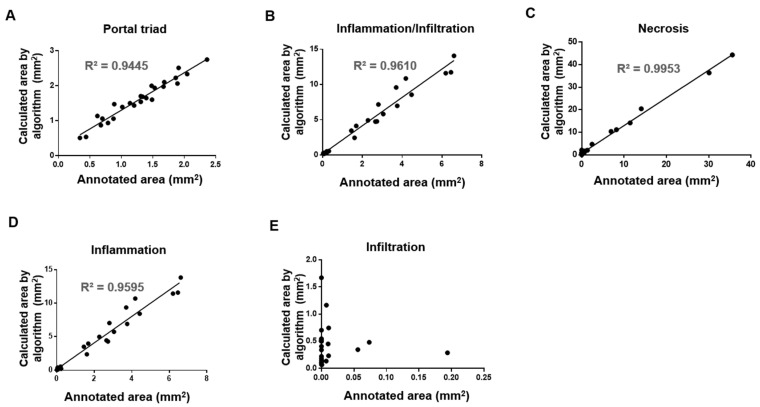
Figure 5.
Correlations between annotated area and algorithm-predicted area. The areas annotated by an accredited toxicologic pathologist were compared by linear regression with those predicted by the established algorithm for portal triad (A), inflammation and infiltration together (B), necrosis (C), inflammation (D), and infiltration (E). The prediction was performed using 20× magnification-scale images.

