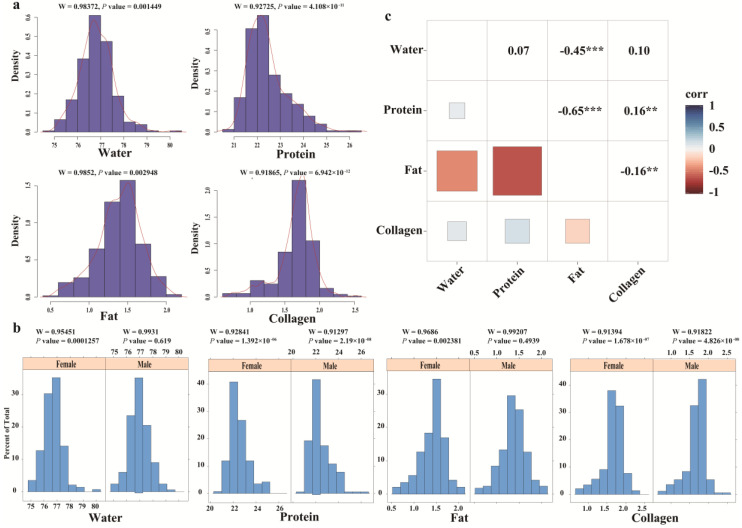
Figure 1.
The phenotype of meat quality statistics analysis. (a) Frequency distribution of the adjusted phenotypes of meat quality; (b) frequency distribution of the adjusted phenotypes of male and female meat quality; (c) pairwise Pearson correlation coefficients for the four meat quality traits; ‘**’ represents the p value less than 0.01 (p value ≤ 0.01); ‘***’ represents the p value less than 0.001 (p value ≤ 0.001).

