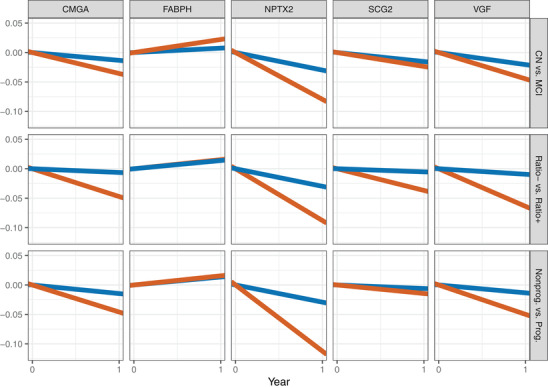
FIGURE 1.

Mean yearly rates of change in the cerebrospinal fluid concentration of each of the five studied analytes (columns) in subgroups of study participants defined by baseline diagnosis (Model 1; first row), baseline phosphorylated tau (p‐tau)181/amyloid beta(Aβ)1‐42 ratio positivity (Model 2; second row) and progression (Model 3; third row). CN: cognitively normal (blue); MCI: mild cognitive impairment (red); Ratio+: participants with p‐tau181/Aβ1‐42 ≥ 0.025 (red); Ratio–: participants with p‐tau181/Aβ1‐42 < 0.025 (blue); Prog.: progressors (red), that is, participants who were initially diagnosed as CN (resp. MCI) and who were diagnosed within 4 years and 1 month after the initial diagnosis with MCI or dementia (resp. dementia). Nonprog.: non‐progressors (blue). The x‐axis corresponds to a period of 1 year.
