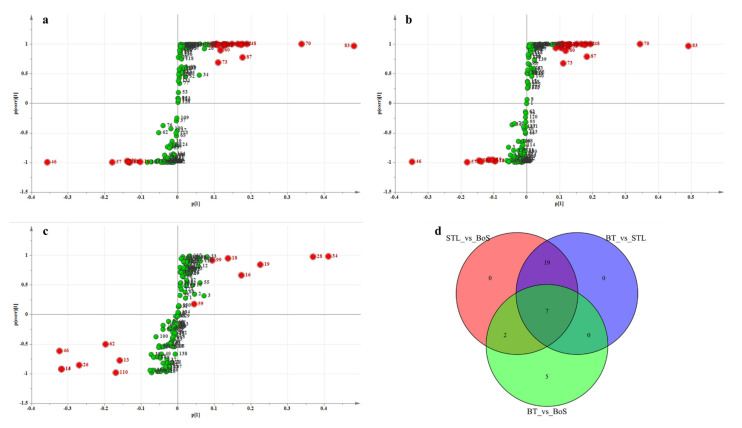
Figure 3.
Differential volatile metabolites (VMs) in BT vs. STL, STL vs. BoS, and BT vs. BoS. S-plot generated from the PLS-DA model for BT vs. STL (a), STL vs. BoS (b), and BT vs. BoS (c). Green and red spots indicate all VMs involved in the model, and red spots show the most significant changes and higher contributions to the classification pattern. (d) Venn diagram of the differential VMs in BT vs. STL, BoS vs. STL, and BT vs. BoS. STL, Strobilanthes tonkinensis Lindau; BT, black tea; BoS, black tea with added STL.

