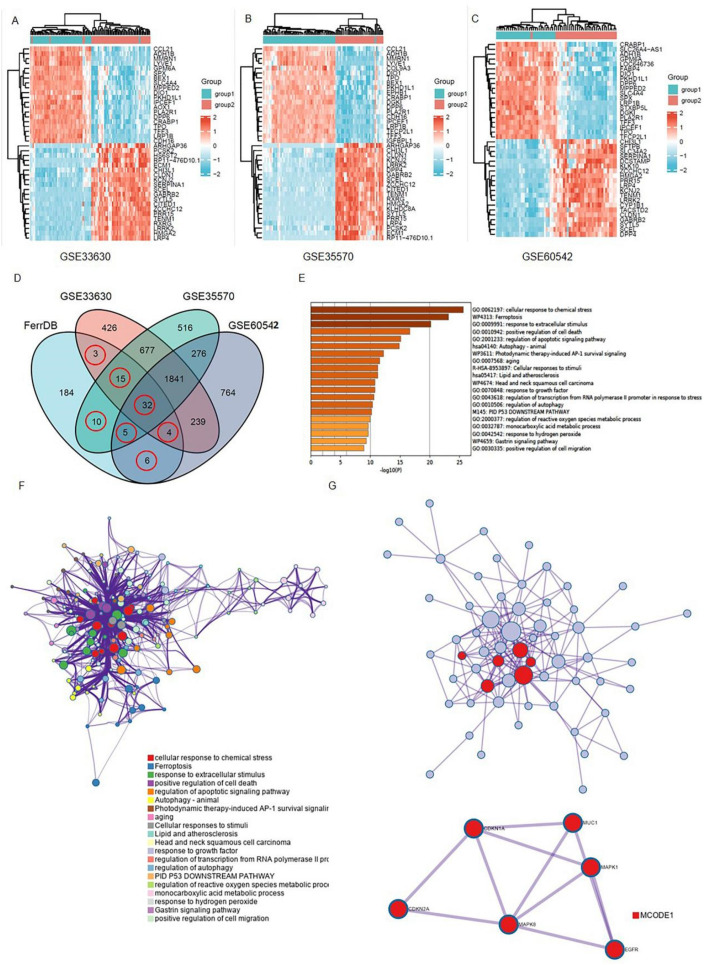
Figure 1.
Brief summary of the ferroptosis signals that are differentially expressed in THCA: (A–C) Ferroptosis-related gene expression profiles in normal and tumor samples in the datasets. The expression of genes was used to group them together. High expression is represented by red, whereas low expression is represented by blue; (D) a Venn diagram depicting the dysregulated ferroptosis genes that were found in all four datasets; (E,F) a graph depicting the GO and KEGG analyses based on Metascape Online, as well as a bar plot and a network depicting the distribution and relationships between the various functions; (G) the hub genes in the ferroptosis gene collection are shown in the PPI network and MCODE. Red balls are MCODE1.

