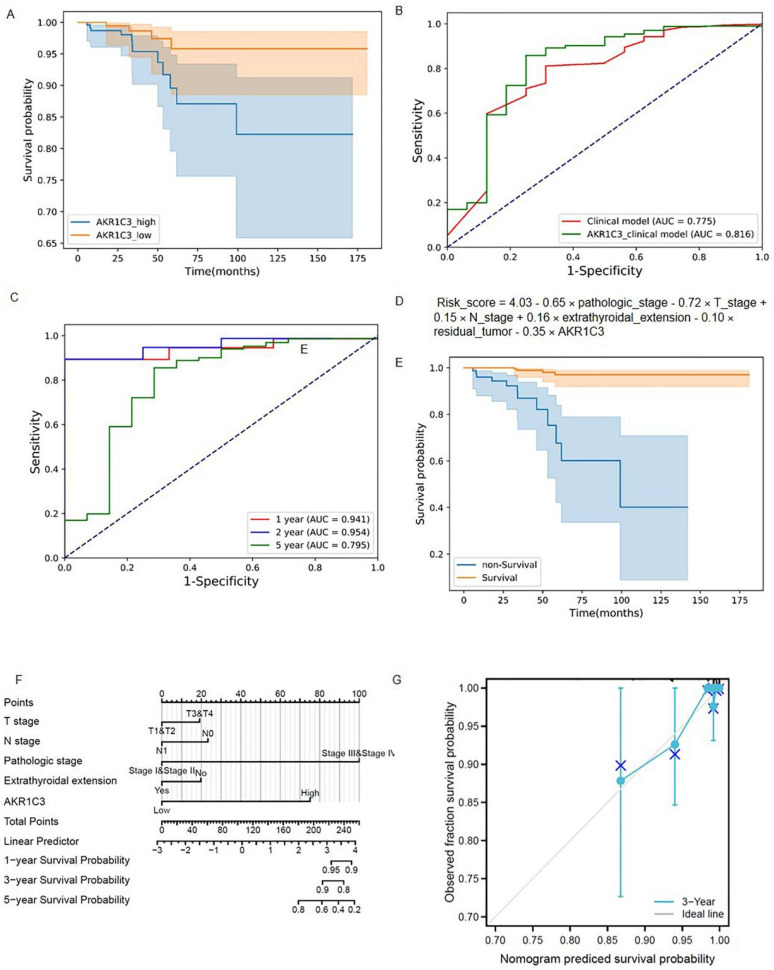
Figure 3.
The predictive model construction. (A) Kaplan–Meier survival curves of the AKR1C3_high group and AKR1C3_low group; (B) ROC curves of the AKR1C3_clinical model and clinical model; (C) ROC curves of the AKR1C3_clinical model and clinical model at one, two, and five years; (D) risk score of the AKR1C3_clinical model; (E) Kapla–Meier survival curves of the predictive survival group and predictive non-survival group using the AKR1C3_clinical model; (F) Proposed nomogram to predict 1-,3-, and 5- OS for THCAe; (G) calibration curve for the probability of the 3-year OS.

