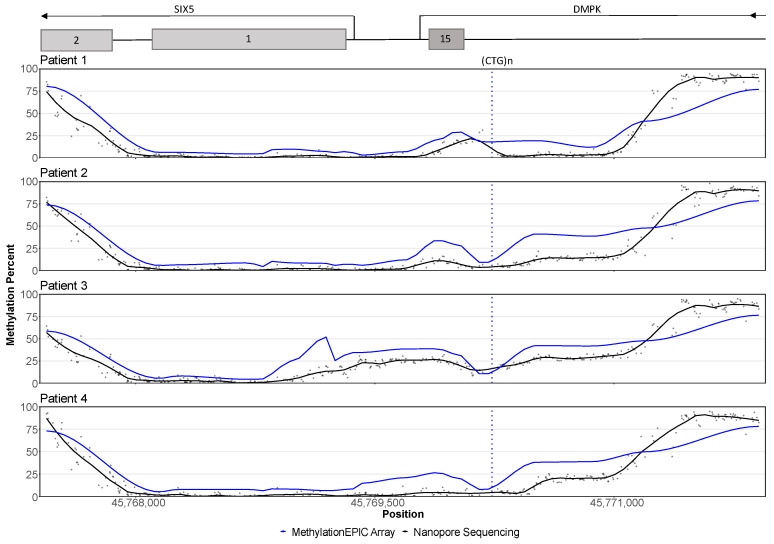
Figure 4.
CpG methylation profiles of the patients. EPIC array data (blue lines) from 22 CpG sites is compared to nanopore raw data from 400 CpG sites (black points) and nanopore smoothed data (black lines). The y-axis represents the methylation level in percent and the x-axis represents the genomic position. The position of the CTG repeat is marked with a vertical blue stippled line and the approximate positions of nearby genes are indicated at the top of the plot. Patients 2 and 3 show hypermethylation both upstream and downstream of the repeat. In patient 1, hypermethylation is seen downstream of the repeat, while the methylation levels upstream of the repeat are less clear. Patient 4 has an opposite pattern of patient 1, with clear upstream hypermethylation and possible hypermethylation downstream of the repeat. The methylation patterns observed with EPIC arrays and nanopore sequencing are similar, although nanopore data show lower methylation levels around the repeat, and higher levels towards the upstream end of the CpG island.

