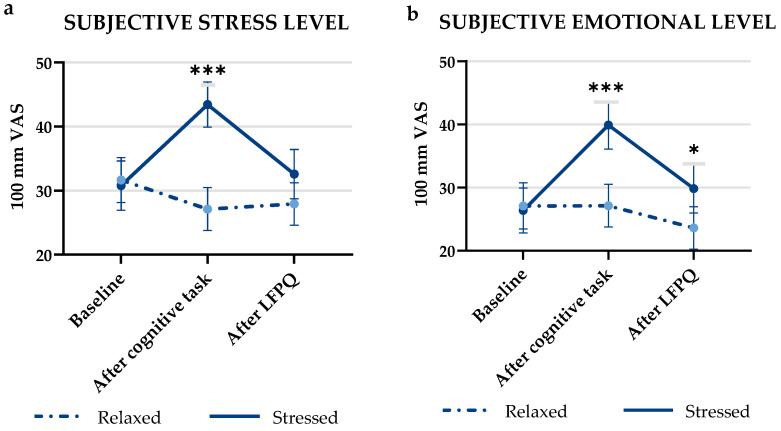
Figure 3.
(a) Mean (±SEM) subjective stress levels measured at baseline, after the cognitive task and after performing the Leeds Food Preference Questionnaire (LFPQ), rated on a 100 mm visual analogue scale. (b) Mean (±SEM) subjective emotional levels measured at baseline, after the cognitive task and after performing the Leeds Food Preference Questionnaire (LFPQ), rated on a 100 mm visual analogue scale. Stars indicate level of significance of p-values. *: p < 0.05, ***: p < 0.001.

