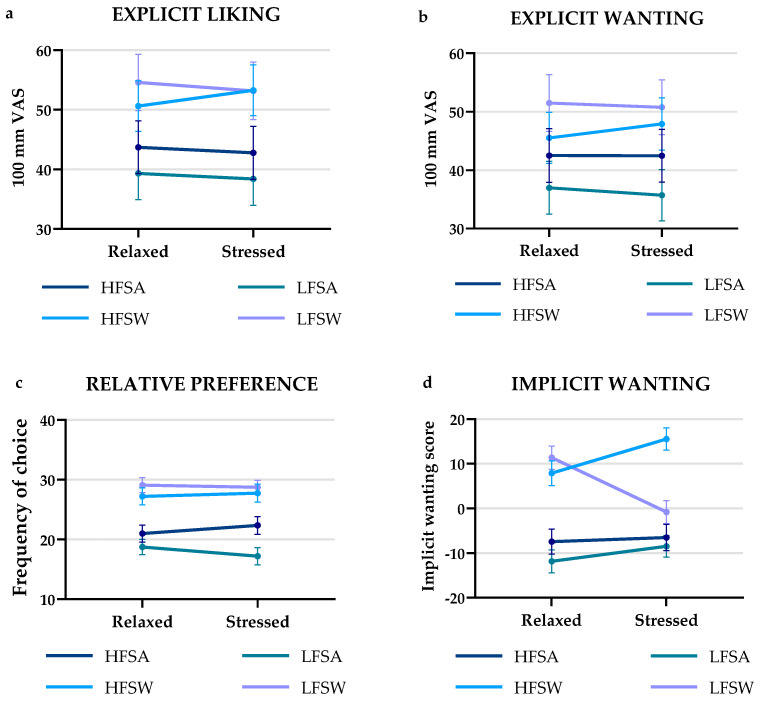
Figure 4.
Interaction plots for (a) explicit liking (mean ± SEM), (b) explicit wanting (mean ± SEM), (c) relative preference (mean ± SEM) and (d) implicit wanting (mean ± SEM), for the four different food categories. HFSA: high-fat savory; HFSW: high-fat sweet; LFSA: low-fat savory; LFSW: low-fat sweet.

