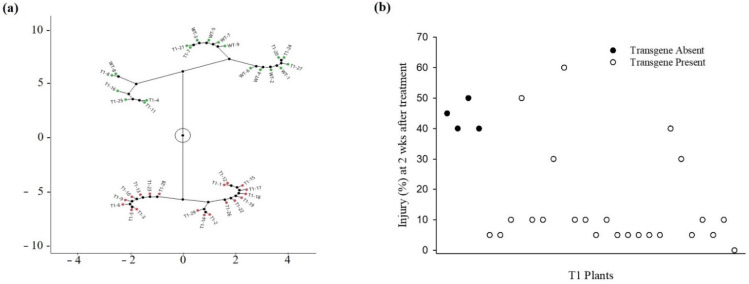
Figure 1.
Response of transgenic rice plants to foliar-applied fomesafen (780 g ha−1). (a) Constellation plot from the hierarchical clustering analysis of T1 and wild type (WT) injury data collected 2 weeks after foliar treatment. Cluster 1 (red) is composed of plants showing low injury. Only T1 plants were part of cluster 1. Cluster 2 (green) is composed of plants showing high injury. Both WT and T1 were present in cluster 2. (b) Scatter plot of foliar injury levels of T1 plants with (white circles) or without (black circles) the ΔG210-Apppo2 transgene.

