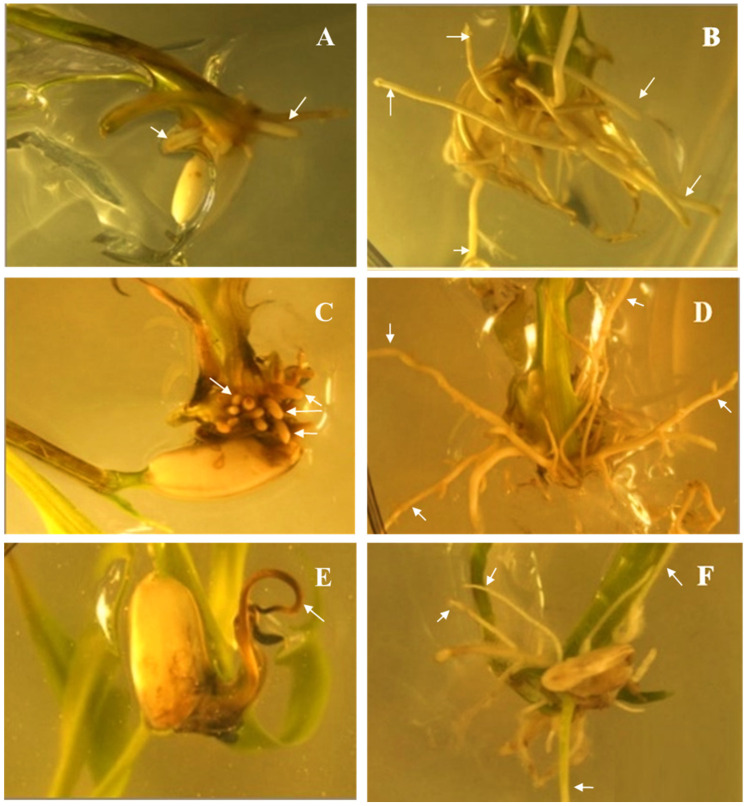
Figure 5.
Agar-based assay showing root growth of rice seedlings in different concentrations of fomesafen. Root growth of wild type at 5 μM (A), 40 μM (C), and 100 μM (E), root growth of T2 plants at 5 μM (B), 40 μM (D), and 100 μM (F). White arrows show inhibited root growth in (A,C,E); and healthy root growth in (B,D,F).

