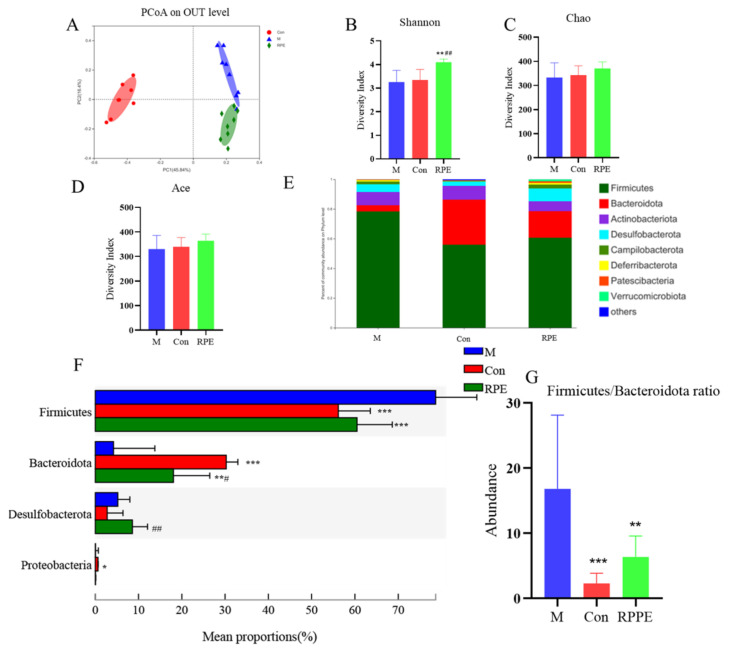
Figure 4.
PCoA plot of gut microbiota at genus level (A). Shannon index (B). Chao index (C). Ace index (D). The components (E) and comparisons (F) of gut microbiota at phylum level. Firmicutes/Bacteroidota ratio (G) Note: * p < 0.05, ** p < 0.01, and *** p < 0.001 versus the M group; # p < 0.05, ## p < 0.01, and vs. the Con group.

