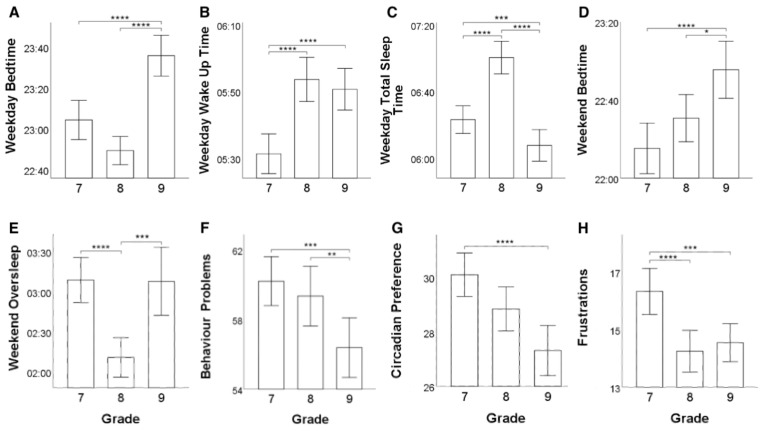
Figure 1.
Bar plots representing the significant differences in terms of sleep patterns and academic stress across school grade groups. Specifically, the figure reports differences across school grades in terms of: (A) weekday bedtime; (B) weekday wake up time; (C) weekday total sleep time; (D) weekend bedtime; (E) weekend oversleep; (F) sleep/wake behaviour problems; (G) circadian preference; and (H) stress derived from frustrations (* p < 0.017; ** p< 0.01; *** p< 0.001; **** p< 0.0001).

