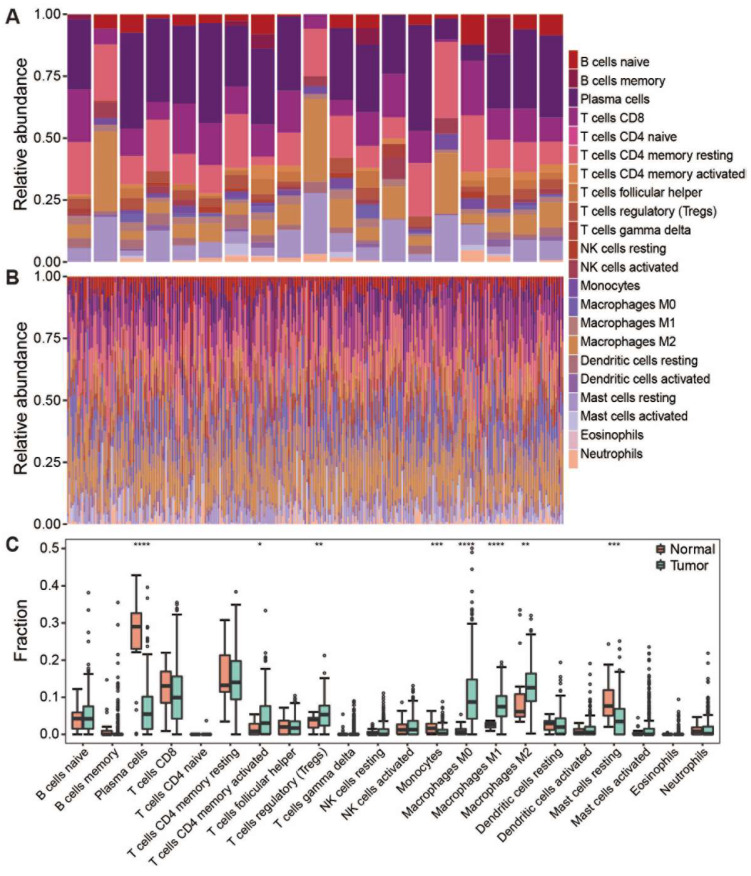
Figure 1.
The composition of infiltrating lymphocytes in tumor and normal samples. (A) Stacked histogram showed the composition of 22 immune cells in normal samples. (B) Stacked histogram showed the composition of 22 immune cells in tumor samples. (C) Boxplot showed infiltration of 22 immune cells in normal and tumor samples. Dot means immune cell fraction in each sample. **** p < 0.0001, *** p < 0.001, ** p < 0.01, * p < 0.05.

