Figure 6.
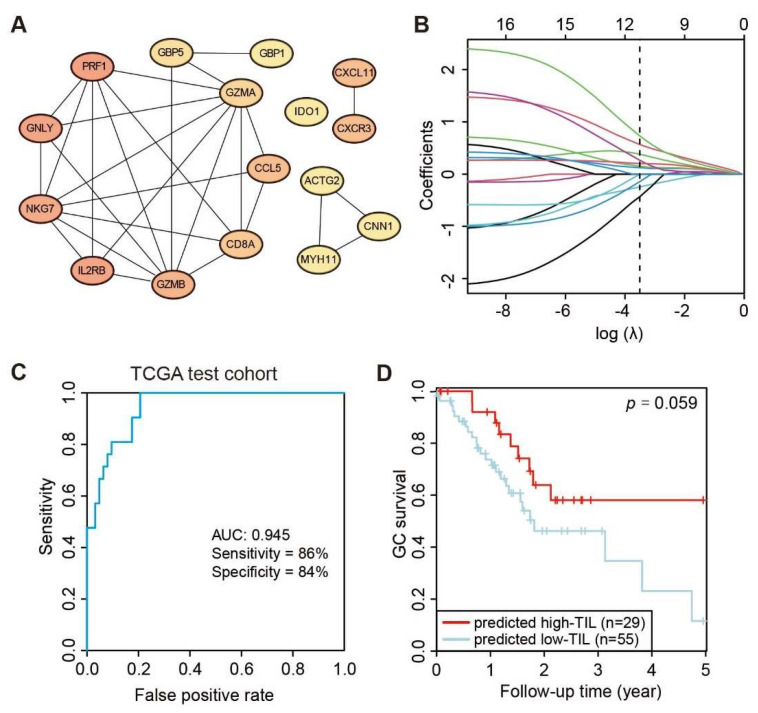
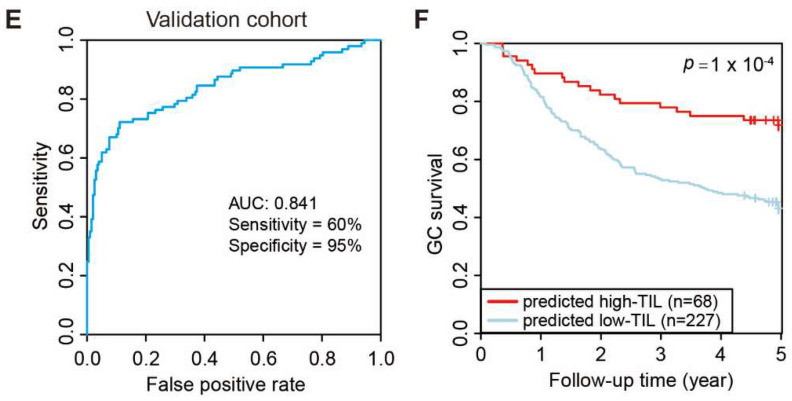
Development of predicting model relative to high-TIL subtype. (A) PPI network of 16 hub genes. (B) Least absolute shrinkage of the selected genes. (C) Receiver operating characteristic (ROC) curves of predictions based on 11 gene expression levels in the TCGA test cohort, n = 82. (D) Kaplan–Meier curve (log rank test) showing OS for the predicted high-TIL and low-TIL subtypes in the TCGA test cohort. (E) Receiver operating characteristic (ROC) curves of predictions based on 11 gene expression levels in ACRG validation cohort, n = 295. (F) Kaplan–Meier curve (log rank test) showing OS for the predicted high-TIL and low-TIL in the ACRG validation cohort.


